Use case intended for:
Practitioners/planners involved in reconstruction projects.
Author: Carolina Rogelis
Introduction:
Housing is one of the sectors commonly most severely affected by disasters (Fondo Adaptación 2013; Consejo de Ministros 2017). Housing reconstruction should take into account local resources, capacities, needs, expectations, potentials and constraints in a framework that ensures to “build back better”. Resilience should be a key principle in housing reconstruction to ensure that previous risk conditions are not recreated and that spatial planning incorporating risk management is a guiding concept.
Housing reconstruction is one of the most challenging processes after a disaster, requiring integrated and coordinated efforts of both communities and institutions. This use case provides an overview of the main flood risk considerations to be taken into account in housing reconstruction as a starting point for discussion.
The first section of this use case presents two examples in the Latin America and the Caribbean region of approaches to consider flood risk in housing reconstruction; the second section introduces a possible approach to inform housing reconstruction projects from the flood risk perspective; the third section proposes the required expertise to undertake the approach presented in section 2; and finally section 4 presents the conclusions.
Objective:
Provide an overview of the main flood risk considerations to be taken into account in housing reconstruction as a starting point for practitioners/planners.
Structure:
This document comprises the following sections:
1. Examples of approaches to consider flood risk in housing reconstruction – experiences in the region.
1.1 The Colombian case
2.2 The Peruvian case
Possible approach to inform the decision to reconstruct in situ or not, from the flood risk perspective:
2.1 Phase 1 – Risk identification
2.2 Phase 2 – Detailed hazard assessment
2.3 Phase 3 – Risk assessment
3. Required expertise
4. Conclusion
1. Examples of approaches to consider flood risk in housing reconstruction – experiences in the region
There are two interesting experiences of reconstruction after hydrometeorological disasters in the Latin America and the Caribbean region that serve as examples and from which key pieces were extracted to propose the method outlined in this use case. The first, is the reconstruction process that has been carried out in Colombia after the impacts of La Niña 2010-2011 and the second, is the reconstruction process in Peru after the impacts of the Coastal El Niño 2017. Both of these processes have a strong emphasis on housing, since this was one of the most severely affected sectors. Therefore, the approach taken by Colombia and Peru can serve as an experience from which to learn for future housing reconstruction projects in the region.
1.1 The Colombian case
The La Niña phenomenon that occurred between April 2010 and June 2011, caused record precipitation in Colombia. About 4 million people were affected and more than 100,000 families reported their houses as destroyed. The reconstruction process was founded in two pillars: flood risk mitigation and community participation. The housing program includes two types of interventions, according to hazard/risk analyses (Fondo Adaptación 2013):
1. Reconstruction in-situ: in cases where the destroyed house is located in low flood hazard zones or mitigable flood risk zones. The houses can be adapted to mitigate the risk, for example by using floodproofing techniques such as buildings on stilts or floating structures.
2. Relocation/resettlement: in cases where the destroyed house is located in non-mitigable high or non-mitigable medium flood risk zones.
Three phases can be identified in this process:
Phase 1 – Flood Risk verification: This phase implies the identification of the effects of the occurrence of flood hazard and a preliminary qualitative assessment of current flood risk. This phase is carried out during the verification of the effects of the event in the structures to be intervened. The objective of this phase is to identify further studies and foresee the resources and time that they will require. Two main steps are considered:
1. Fieldwork: relevant field information is surveyed of the structure and surroundings to verify damages and related hazards.
2. Compliance with normativity: the compliance with legal, environmental and planning normativity is reviewed for all the plots of land where the structures are localized. This process allows to identify any restriction to construction in the zone of the intervention.
Phase 2 – General flood hazard study: This phase is aimed at identifying, georeferencing and quantifying the hydrometeorological hazards in the intervention areas.
Phase 3 – Flood Risk study: In cases where the interventions are located in medium and high flood hazard zones, a more in-depth analysis is required to define if the flood risk can be reduced modifying the hazard or the vulnerability. From a preliminary analysis, the feasibility of flood hazard reduction through mitigation works and/or the reduction of vulnerability must be assessed. If feasibility is positive, a detailed flood risk study should be carried out to design strategies to reach a low risk level. The mitigation alternatives should be assessed through modelling to estimate their risk reduction and cost-benefit analysis should be carried out to choose the most cost-effective alternative.
1.2 The Peruvian case
The Coastal El Niño 2017 caused severe damage in 45,613 houses that were classified as uninhabitable (recoverable structural damage) accounting for 70% of the total (31,813) or collapsed (irrecoverable structural damage) accounting for 30% of the total (14,792 houses) (Consejo de Ministros 2017).
The construction material of the uninhabitable houses was identified and two categories were used: (i) bricks or concrete blocks and (ii) other materials such as wood or adobe. The summary of the classification of the houses is shown in Figure 1.
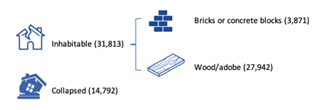
Figure 1. Classification of houses according to damage state and material. Adapted from: Consejo de Ministros (2017)
A risk assessment is carried out in the affected areas to identify zones where the risk is very high and non-mitigable (Consejo de Ministros 2017).
According to the classification of the houses, the Ministry of Housing has established three types of family housing bonds (FHB): reinforcing, construction in-situ and purchase of new house (relocation or resettlement). These bonds are assigned as a function of the level of damage, risk and material of the affected house according to the criteria shown in Figure 2
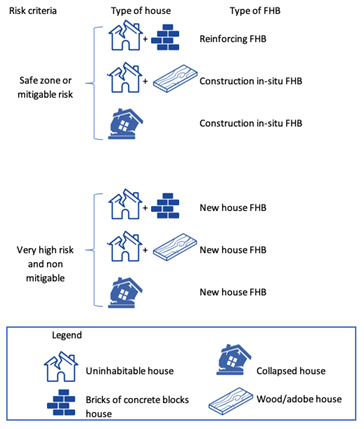
Figure 2. Criteria to assign the family housing bonds (FHB) in Perú. Adapted from: Consejo de Ministros (2017)
As exemplified by the experiences in Colombia and Peru, the analysis of the feasibility to mitigate risk is key to establish a process that adequately informs the decision to reconstruct in situ or not.
2. Possible approach to inform the decision to reconstruct in situ or not, from the flood risk perspective
This section proposes a possible approach to inform housing reconstruction projects from the flood risk perspective taking as a basis the experience of Colombia and Peru and taking into account that the feasibility of mitigation is a key aspect to be assessed. Figure 3 shows, -from the flood risk perspective-, a possible approach to identifying houses that could be rebuilt in-situ. This possible approach is presented to establish a framework for discussion; it is not intended as an operative procedure to be implemented as it is, but as a workflow that helps to show key aspects that could be taken into account in the decision to reconstruct in-situ considering the experiences in the region.
Figure 3 shows three phases:
- Phase-1 Risk identification: preliminary qualitative risk assessment, prioritization and planning of further studies.
- Phase-2 Detailed hazard assessment: aimed at studying hazard in sufficient detail in terms of intensity and probability, to identify the hazard level zone in which each of the sites/houses is located. In general, a detailed hazard assessment will include the following stages:
- Inception stage: comprises a review and analysis of existing information (relief, geology, geomorphology, hydrology, flood history, hydrometeorological data availability, etc.); and confirmation of the type of floods that affect the area to be studied.
- Hazard assessment and mapping: in this stage the characteristics of flood hazard are assessed and mapped. This stage involves the definition of criteria for hazard analysis, in terms of the return periods and intensity criteria to be studied according to the scenarios required for decision making. Thus, a policy decision should be made on the conditions of hazard that are acceptable for reconstruction in-situ, and a zoning of the flood prone areas is obtained. In this stage a screening would be possible, if a policy is developed for land use, where residential use is permitted for some flood hazard zones (e.g., low hazard zones).
- Phase – 3 Risk assessment: is aimed at defining the feasibility to mitigate risk (modifying hazard and/or vulnerability). This analysis can be further divided into two stages:
- Preliminary risk assessment: based on hazard and vulnerability information, a preliminary analysis on the feasibility of flood management measures to reach an acceptable risk level is carried out.
- Detailed risk analysis to generate a flood risk management plan
In the following subsections a description of each phase is presented.
2.1 Phase 1 – Risk identification
Key aspects in a risk identification process are: identify and verify damages caused by past events; identify flood types, causes and mechanisms (OPW 2015); collect data to describe historic floods (Thieken et al. 2017); identify hazards, vulnerability and risk and carry out a qualitative assessment of current risk; and identify the need and scope of further and more detailed flood risk studies.
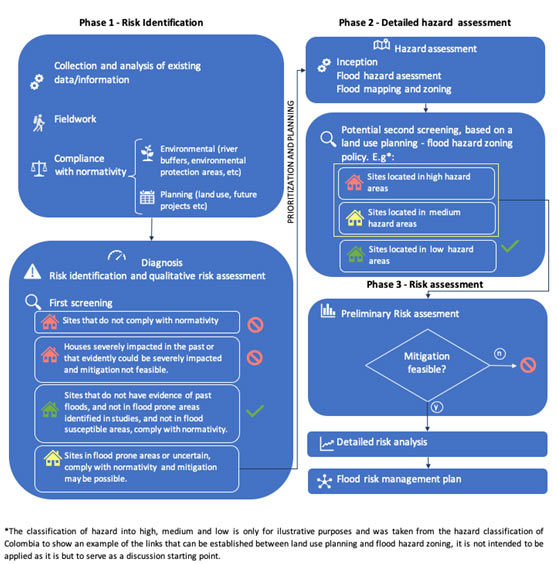
Figure 3. Overview of an example of flood approach to identify houses to be rebuilt in-situ
To achieve the objectives of the risk identification phase, the following activities should be considered:
- Collection and analysis of existing data/information. The information collected can be organized and recorded in electronic format by means of different software applications such as ArcGis, QGis, SAGA, Grass Gis, Word, Excel, Acrobat etc.
- Compliance with normativity
- Fieldwork. Collecting information on past flood events is highly important in improving the understanding of flooding and provides information on how best flood risk can be managed. Flood information can inform development plans, emergency response plans, flood hazard mapping, flood risk assessment and planning decisions (OPW 2015).
Fieldwork should be carefully planned. Maps should be used to document target areas and relative priorities should be established. Before going to the field, it is important to familiarize with the area by studying existing maps (Googlemaps, GoogleEarth, existing hazard maps, hydrography, historical floods etc.) and by understanding the characteristics of the area before visiting the site. It is useful to identify regions to be surveyed on a map. Then, the regions can be divided in sub‐regions and assigned to data collection teams (Berni et al. 2017). It is also very important to contact the local authorities and communities in advance and obtain the required permissions, if necessary.
Forms should be used in the field to collect data, not only from the observations of the surveyor but also from the residents of the house (Follow the link forms for an example of survey form). Forms can be implemented in applications for mobile phones or tablets that can provide connection with a server for data storage and also can provide functionality to automatically collect data. An example of these type of tools is FEDCAP (Flood Event Data Capture tool) developed by SEPA (Scottish Environmental Protection Agency)(SEPA 2016). FEDCAP utilizes ArcGis Online and the ESRI Collector App. Another similar tool is HOWAS2, the flood damage database for Germany (Kreibich et al. 2017).
The collection of data in the field should:
- avoid data duplication;
- minimize data collection efforts by integrating existing successful practices; and
- guarantee data sharing and integration (Berni et al. 2017).
Each site/house that requires assessment should be visited during fieldwork. The site visits should be carried out by a team with the capacity to:
- collect all needed information;
- take a photographic record; and
- identify basic technical and risk aspects.
During fieldwork it is very important to identify key descriptors of historical floods such as:
- flood extent/level;
- time and duration of the flood;
- source and mechanism of flooding (OPW 2015), see Figure 4 for a classification of sources and Figure 5 for mechanisms;
- water depth in the property and surrounding area;
- photos and videos;
- damage to roads;
- impact on public utilities;
- impacts to the community;
- environmental impacts;
- precautionary measures in place, early warning, and emergency measures undertaken;
- assessment of mitigation works;
- current condition, performance and influence on flooding processes of hydraulic structures;
- tide level and its impact on flood levels should be investigated as well as the influence of storm surge;
- analysis of the scouring conditions in the streams and possible effects on the houses located close to the banks;
- number of death or injured, nature of injuries and number of residents and houses affected.
The information collected during fieldwork can be displayed in a map of the flooded area (as determined from residents´ reports, photographs etc.) with peak flood levels, if available. It is important to sketch the approximate extent of the flood and explain what information was used. Important attribute information that should be shown in a flood event map include date, time, depth, source and location, location of photos, location of level measurement site and location of anecdotal information. Figure 6 shows an example of a flood event map. This also shows the time when water depths were taken since the area was still flooded when the information was collected.
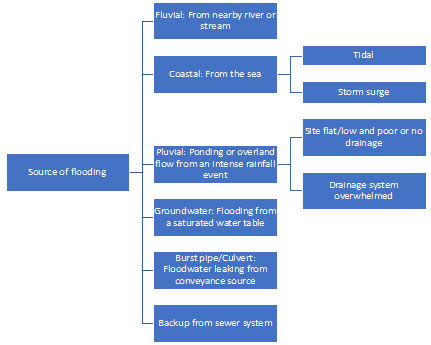
Figure 4. Sources of flooding. Source: adapted from OPW (2015)
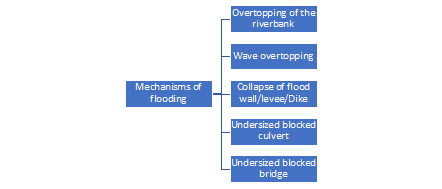
Figure 5. Mechanisms of flooding. Source: adapted from OPW (2015)
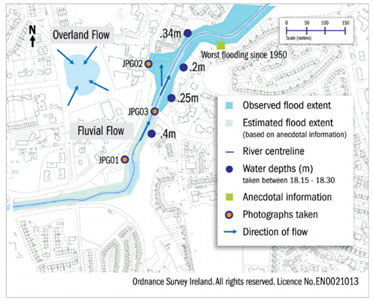
Figure 6. Example of a map of a flood event. Source: OPW (2015)
- Risk identification and qualitative risk assessment
A technical analysis of data and information to evaluate the house/site should lead to the following results: Identification and verification of damages; Identification of flood types, causes and mechanisms; identification of flood hazard, vulnerability and risk; and qualitative assessment of current risk.
An indicative qualitative assessment of hazard, vulnerability and risk may be carried out with the available data. Two approaches that are complementary could be used: historical and geomorphological. Historical approaches are based on historic documentation (archives, reports, newspapers etc.) and testimonials (e.g. community consultations) to reconstruct the extent, depth and flood characteristics of a historic event (Díez-Herrero et al. 2009). The reconstruction of the historic events can include the conversion of levels into discharges, which can be used for hydrological and hydrodynamic modelling (Díez-Herrero et al. 2009).
The result of detailed historic analyses of various kinds of data is an “event map” showing the extent of one or several flood events. If other information is available, the recurrence interval (or at least a qualitative statement about recurrence, like frequent, rare, very rare) can be attributed to the particular event. Additional information like water depth, flow velocity or similar parameters might be available (World Meteorological Organization 2013). However, there are several limitations in this type of maps: a) the correlation of the data recorded from various extreme events is not guaranteed because between two flood events the potential inundated area might have changes in the infrastructure, topography etc.; b) in several cases each flood event is unique (e.g. dam-break); c) lack of water velocity measurements results in a generally inaccurate flood hazard determination, because flood hazard depends both on the water depth and the water velocity values (Bellos 2012). If only a few or only one flood event is available for the analysis, this does not provide information on all past flooding events or probability of flooding, it simply highlights that flooding did occur. Also historical flood maps are restricted in the sense that they are impossible to compare when boundary conditions (streambed, land cover etc.) change significantly over time (de Moel et al. 2009).
Geological-Geomorphological approaches use the arrangement and types of landforms and deposits generated during or after the flood event. With these methods, geomorphologically active areas can be delimited within the stream channel and its banks, allowing the identification of areas prone to flood inundation within the framework of the stream’s natural dynamics, their qualitative flood frequency, and even infer the order of the magnitude of certain parameters such as depth, velocity and transported sediment load (Díez-Herrero et al. 2009). These methods can complement hydrologic/hydrodynamic methods contributing to reduce uncertainty (Benito et al. 2004).
Geomorphological methods can produce susceptibility and hazard maps. The scale of the map will depend on the initial information available (topographic data, aerial photographs etc). If topographical or photographic information at appropriate scales is available, the ideal scales to obtain a geomorphological map focused on flood hazards vary between 1:2,000 and 1:5,000 (Díez-Herrero et al. 2009).
- Potential first screening
Bearing in mind a precautionary approach, from the historical and geomorphological information supported in a clear understanding of the flood risk drivers and flood hazard sources, causes and mechanisms, a first screening could be carried out.
- houses that do not comply with normativity or any other legal requirement may be discarded for further analysis;
- houses severely impacted in the past or that evidently could be severely impacted and where mitigation is not feasible could be considered not eligible for reconstruction;
- sites that do not have evidence of past floods, and are not in flood prone areas identified in studies, and are not in flood susceptible areas, and comply with normativity, may be considered potential reconstruction sites;
- and sites in flood prone areas or that are uncertain to be in a flood prone area or not that comply with normativity and where mitigation may be possible could be considered for further and more detailed studies. In all cases, evidence and technical justification for any recommendation should be provided.
2.2 Phase 2 – Detailed hazard assessment
Detailed hazard assessments are carried out in phase 2 according to the identification of further studies and prioritization obtained in phase 1. These studies should be carried out bearing in mind a fit-for-purpose approach that implies that the level of detail and type of hazard study is appropriate for the characteristics of the flood risk and the decisions to be made (RIBA 2009; State of Queensland 2014). A principle to be taken into account is that the sophistication of the studies may also vary depending on how concentrated exposure is. More sophisticated techniques can be used in areas with concentrated exposure (e.g. urban areas) and simpler techniques used in areas where development is more widespread (e.g. rural areas) (BMT WBM Pty Ltd 2017). This distinction implies also a difference in scale. For example, studies in rural areas can be carried out at coarser scales than urban areas (Ministerio de Vivienda Ciudad y Territorio 2014).
In general, detailed studies are carried out at scales of 1:2,000 to 1:25,000 (World Meteorological Organization 2013; Els and Van Niekerk 2013), however scales between 1:2,000 to 1:10,000 are desirable for local planning, particularly in dense urban areas.
Several flood hazard assessment methodologies exist (for more information on flood hazard mapping methodologies see Díez-Herrero et al. (2009) and the methodology section of the CHARIM handbook). The use of mathematical models has been gradually developed and introduced as an essential tool to produce flood maps (World Meteorological Organization 2013); for detailed analysis this is the usual method to be applied, although a combination of modelling with historic and geomorphological methods is also used.
It is desirable to include in the analysis aspects such as climate change (sea level rise, rainfall intensity increases and/or other climate change variations) and human actions that may increase risk in the future (e.g. deforestation and changes in vegetation cover, surface sealing of large areas in the watersheds and interventions in the channels and floodplains) (Díez-Herrero et al. 2009).
Flood zoning is widely used to divide the flood prone areas into zones where the flood hazard is different and define the types of development and land use that are suitable in each zone. The purpose of flood zoning is to prevent inappropriate development by only allowing certain types of development and land use in areas where the flood hazard is highest (Sayers et al. 2013). The choice of events to be modelled, mapped and used for floodplain zoning might be influenced by potential flood risk, characteristics of the catchment, legacy issues, design levels of critical infrastructure and requirements for flood mitigation (BMT WBM Pty Ltd 2017) as well as available information and modelling approach. Therefore, floodplain zoning criteria significantly vary worldwide. Then, a discussion on the flood mapping and zoning to be applied would be needed at this phase to decide the most suitable approach under the particular conditions of the reconstruction project.
At this stage a second screening could be applied following the experiences of Colombia and Perú. For this second screening, the development of a policy linking land use planning and flood hazard zoning would be required. Then, if different flood hazard zones can be identified, a decision to accept hazard for residential use (acceptable risk) could be made, to allow development in flood hazard areas were the characteristics of floods permit a proper flood risk management through the implementation of building codes (including floodproofing), early warning, education/awareness and insurance.
2.3 Phase 3 – Risk assessment
Risk assessment is aimed at defining the feasibility to mitigate risk (modifying hazard and/or vulnerability) and defining a comprehensive flood risk management strategy. This analysis can be further divided into two stages:
Preliminary risk assessment: based on hazard and vulnerability information a preliminary analysis on the feasibility of flood management measures to reach an acceptable risk level is carried out.
Detailed risk analysis: Once feasibility is established; a detailed risk analysis is carried out to define mitigation measures and a flood risk management plan that ensures an acceptable flood risk level. Mitigation alternatives should be assessed in terms of the effective risk reduction they provide (benefit) and cost, in order to choose the most cost-effective measures. As flood risk management principle, a group of comprehensive measures implemented in an integrated way are expected to be the most efficient approach.
Required expertise:
In order to carry out the process shown in Figure 3, a team with relevant background and experience is crucial.
For phase 1 the following personnel is desirable:
- Geomorphologist with at least 15 years of relevant experience in hydrogeomorphic hazards, mountain hazard/risk assessment and disaster risk management.
- River hydraulics engineer with at least 15 years of relevant combined experience in flood hazard/risk assessment, integrated urban flood risk management, mountain river hazards, river basin management, hydraulic engineering, flood modelling, hydrology, water resources management and disaster risk management.
- Structural Engineer or Architect (pathology of construction background): Experience in disaster risk management projects and evaluation of structural vulnerability or pathology in buildings. Minimum experience of 10 years.
- Planners: Engineers/architects with planning experience. A joint work between the planners and the experts would be required to discuss and integrate the identification of hazards, risk and vulnerabilities into planning decisions.
- Data collection team: Civil engineers, no experience required but with the capacity to: (i) collect all needed information; (ii) take a photographic record; (iii) identify basic technical and risk aspects.
- Support team: No specific background required, only capacity to collect information
- Expert in databases and GIS: Systems Engineer (or civil engineer, geographer or forester) with a postgraduate degree in GIS. Experience in the development of GIS tools and programming. Minimum experience of 10 years.
In order to carry out phases 2 and 3 a multidisciplinary team is required, composed of: flood risk management expert, hydraulic engineer/hydrologist, geotechnics engineer, and GIS expert. Social, economic and environmental specialists are also included in the team to support social and environmental vulnerability assessments and risk analysis.
Conclusion:
Housing reconstruction projects involve a high complexity and require considerations from a multidisciplinary perspective, with risk management being a key principle. The aspects presented here provide a starting point for discussion to develop an approach adapted to the context of a particular housing reconstruction project, and are intended to illustrate key flood risk considerations for discussion when planning a housing reconstruction project.
References:
Bellos, V., 2012: Ways for flood hazard mapping in urbanised environments : A short literature review. Water Util. J., 25–31. https://www.ewra.net/wuj/pdf/WUJ_2012_04_03.pdf.
Benito, G. and Coauthors, 2004: Use of Systematic, Palaeoflood and Historical Data for the Improvement of Flood Risk Estimation. Review of Scientific Methods. Nat. Hazards, 31, 623–643, doi:10.1023/B:NHAZ.0000024895.48463.eb. https://doi.org/10.1023/B:NHAZ.0000024895.48463.eb.
Berni, N., D. Molinari, F. Ballio, G. Minucci, and C. A. Munoz, 2017: Best Practice of Data Collection at the Local Scale. Flood Damage Surv. Assess., doi:doi:10.1002/9781119217930.ch6. https://doi.org/10.1002/9781119217930.ch6.
BMT WBM Pty Ltd, 2017: Guide for Flood Studies and Mapping in Queensland. State of Queensland, https://www.dnrm.qld.gov.au/__data/assets/pdf_file/0010/332695/guide-flood-studies-mapping-qld.pdf.
Concejo de Ministros, 2017: Plan Integral de Reconstrucción con Cambios. Lima, Perú, http://www.rcc.gob.pe/wp-content/uploads/2017/08/Plan-Integral-de-Reconstrucción-con-Cambios-18082017.pdf.
Díez-Herrero, A., L. Huerta, and M. Isidro, 2009: A handbook on flood hazard mapping methodologies. http://www.igme.es/Publicaciones/publiFree/HandbookFoodHazard/Pdf para descargar/ A handbook on food hazard mapping tecnologies.pdf (Accessed April 20, 2013).
Els, Z., and A. Van Niekerk, 2013: Data availability and requirements for flood hazard mapping. Possition IT,. http://www.ee.co.za/wp-content/uploads/legacy/positionit_2013/processing_data-hazard_jan-feb13-1.pdf.
Fondo Adaptación, 2013: Manual Operativo Operadores Zonales de Vivienda. Bogotá, Colombia, http://fondoadaptacion.gov.co/manual-contratacion-vivienda/.
Kreibich, H., A. Thieken, S.-N. Haubrock, and K. Schröter, 2017: HOWAS21, the German Flood Damage Database. Flood Damage Surv. Assess., doi:doi:10.1002/9781119217930.ch5. https://doi.org/10.1002/9781119217930.ch5.
Ministerio de Vivienda Ciudad y Territorio, 2014: Decreto Número 1887. http://wsp.presidencia.gov.co/Normativa/Decretos/2014/Documents/SEPTIEMBRE/19/DECRETO 1807 DEL 19 DE SEPTIEMBRE DE 2014.pdf.
de Moel, H., J. van Alphen, and J. C. J. H. Aerts, 2009: Flood maps in Europe; methods, availability and use. Nat. Hazards Earth Syst. Sci., 9, 289–301, doi:10.5194/nhess-9-289-2009. https://www.nat-hazards-earth-syst-sci.net/9/289/2009/.
OPW, 2015: Flood data collector´s handbook. Dublin, https://www.floodinfo.ie/static/floodmaps/docs/past_floods/Flood_Data_Collectors_Handbook.pdf.
RIBA, 2009: Climate Change Toolkit 07 Designing for Flood Risk.
Sayers, P., L. Yuanyuan, G. Galloway, E. Penning-Rowsell, W. K. Shen Fuxin, C. Y. And, and T. Le Quesne, 2013: Flood Risk Management A Strategic Approach.
SEPA, 2016: After the rain – analysing the impacts of flooding. https://www.sepaview.com/2016/03/after-the-rain-analysing-the-impacts-of-flooding/ (Accessed April 16, 2019).
State of Queensland, 2014: Flood mapping implementation kit. Queensland Australia, https://www.dnrm.qld.gov.au/__data/assets/pdf_file/0009/230778/flood-mapping-kit.pdf.
Thieken, A., H. Kreibich, M. Müller, and J. Lamond, 2017: Data Collection for a Better Understanding of What Causes Flood Damage–Experiences with Telephone Surveys. Flood Damage Surv. Assess., doi:doi:10.1002/9781119217930.ch7. https://doi.org/10.1002/9781119217930.ch7.
World Meteorological Organization, 2013: Flood Mapping. Integr. Flood Manag. Tools Ser., 88. www.apfm.info.