

The national-scale landslide susceptibility map, which was presented in the previous use case 8.3, is a generalization, and may not represent the situation always correctly for local situations. This is particularly so for the road network. The nation-wide analysis doesn't take into account the specific conditions along the road network, as information is often lacking on the location of cut slopes, conditions of drainage along the road, and the presence of slope stabilization measures along the road network. Also there is limited information available on the landslides that occurred along the roads, as the road department doesn't keep a database of these events, and the road clearance reports are lost after a few years. Therefore it is also important to focus specifically on the road network and derive a susceptibility map using a slightly different approach than the one for the nation-wide study.
This use case demonstrates the procedure for generating a national landslide susceptibility map along the national road network, based on a series of landslide inventories which were extracted from existing inventories road maintenance records, high resolution satellite images, and field verification. , the collection of a series of maps that represent contributing factors to landslide occurrence, an exploratory statistical analysis, and a Spatial Multi-Criteria Evaluation procedure to generate the susceptibility map, which is then validated using success rate curves, and classified into three classes.
Keywords:
Landslide ; susceptibility; road network; road database; inventory; statistical analysis; SMCE; success rate
| Before you start: | Use case Location: | Uses GIS data: | Authors: |
|---|---|---|---|
| Read chapter 4 from the methodology book, and section 2.3 from the Data Management Book | Dominica with some reference to similar work carried out in Saint Lucia |
Yes, this use case uses GIS data |
Cees van Westen and Yovani Yifru |
Introduction:
The windward Caribbean island countries are of volcanic origin, have deep tropical soils, and are exposed to high intensity rainfall events, including tropical storms and Hurricanes. This makes these countries highly susceptible to landslides. They are also relatively small in size and in population, and often lack the expertise to generate landslide inventory and susceptibility maps. These maps are required as a basis for physical planning and management of critical infrastructure.
Roads are particularly vulnerable to landslides, as even fairly modest landslides can cause disruption of the road network for a considerable amount of time. Since many of the windward islands have a circular primary road network, that mostly follows the coast, interruption of a road can cause severe transportation problems due to lack of alternative routes.
In chapter 4 of the Methodology book the various method for landslide susceptibility and hazard assessment are discussed for the 2 scales relevant on the island. There we also discussed the requirement to generate specific landslide susceptibility maps for the road network, because of the following reasons:
- The national scale landslide susceptibility maps do not take into account the specific road related factors (e.g. such as the location and quality of cut slopes, road drainage etc.) due to lack of data;
- There are different agencies involved in landslide related work along the road network, and in the natural terrain. Public works department is responsible for cleaning roads after landslides have occurred, and the construction of remedial measures. They are generally not specifically focusing on collecting and storing landslide related data, and clearance records may get lost soon. This makes the construction of specific landslide database for the road network a real challenge.
- Landslides from the natural terrain above the road network may interrupt the roads, and therefore it is important to incorporate these in the susceptibility assessment. But along roads specific conditions may lead to landslides in cutslopes, failures below the road due to improper road drainage embankment failures. The road may be both the causal factor for the landslide and the element-at-risk.
Therefore it is important that Public work Departments also develop their own road-related landslide inventories, and use them to generate landslide susceptibility and hazard maps, to identify the critical points along the road network where remedial measures are required.
This use case addresses the problem of generating national landslide susceptibility maps along the road network.
In this use case, the landslide susceptibility of different sections of the major roads of Dominica are analysed by characterizing them by their topography, geology and soil type. In Saint Lucia more work has been done on landslide susceptibility and hazard assessment along the road following the destructive hurricane Tomas in 2010. A project was carried out by Mott MacDonald that reviewed landsliding following Hurricane Allen and Hurricane Tomas and presented the results as the density of landsliding along different sections of road following the different events. They also carried out detailed studies. At the site scale a geomorphological assessment has been completed by interpretation of 2009 air photographs to identify historical and recent landslides along the network. This air photograph interpretation was then ground truthed by visiting the sites to confirm the desk based assessment was correct and to improve the accuracy of the mapping. Areas along the primary road network have also been zoned to identify slopes adjacent to the road where similar ground conditions, environments and morphology may lead to similar landslide events and ground movements. The zones can assist in highlighting landslide hazards in areas of slopes that may be identified as low landslide risk using the risk matrix approach. The subjective assessment of traffic and alternative routes has resulted indifferent zones of ‘vulnerability' being assigned to parts of the network. This information has been mapped and is presented as a layer within the project GIS.
In Dominica there hasn't been such a large consulting project on assessing the susceptibility, hazard and risk of the road network. Therefore we will show what can be done in such a data-poor situation.
Objectives:
The main objective of this use case is to carry out a comprehensive landslide susceptibility assessment for the major roads of Dominica and generate a national road-related landslide database. This involves the following sub-objectives:
- To generate multi temporal landslide inventory maps along the road network
- To subdivide the road network in segments and characterize these segments by landslide density and by terrain and road characteristics
- To characterize landslide triggering events and relate them to the landslide density along the road network.
- To determine the spatial and temporal probability of landslide occurrence along the road corridors using statistical analysis models
Unfortunately both the historical landslide inventories as well as the spatial factors that should be used for landslide susceptibility assessment are far from complete in most countries. See also the use cases on data management (Chapter 9) and the data management book (chapters 2, 3 and 4). Ideally we would like to generate landslide hazard maps, which show a subdivision of the road network in sectors that are characterized by the expected intensity of landslides within a given period of time, or the probability of landslide occurrence. However, due to limitations in historical landslide data the analysis of frequency-intensity relations is rather difficult, and therefore the resulting map should be called a susceptibility map rather than a hazard map, as it shows a subdivision of the terrain in zones that have a different spatial likelihood that landslides may occur, without a quantitative indication of the relation frequency and density.
Flowchart:
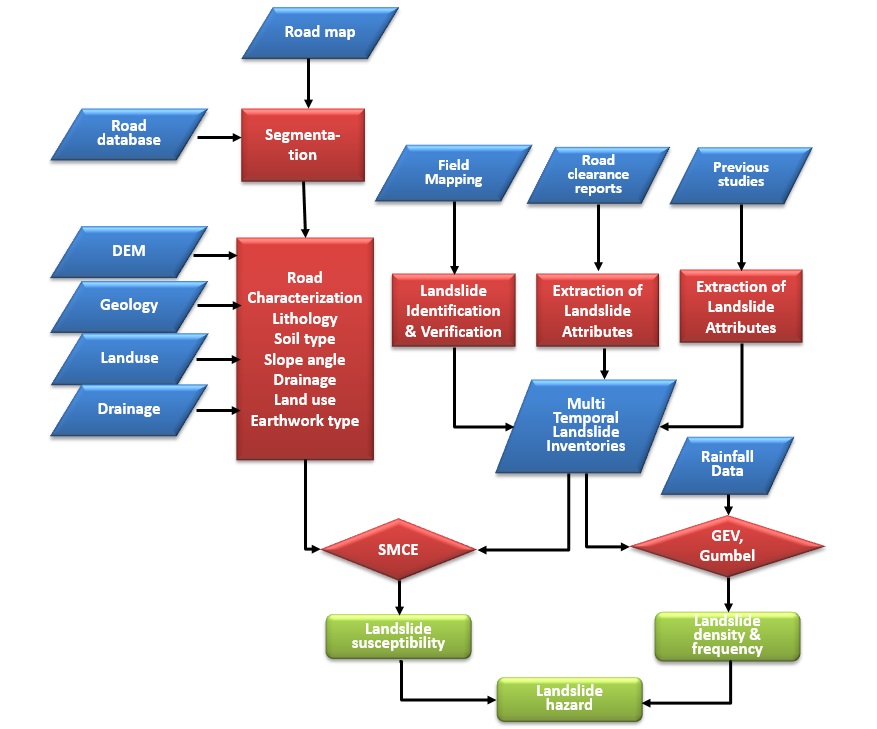
Figure 1: Flowchart of the method followed in this use case
Historical landslide records together with image interpretation and field mapping are used to generate a multi temporal road related landslide database for storm events that have hit the Island of Dominica. The distribution of the landslides triggered by these events on the different road sections are assessed and landslide density per kilometre of the road section is calculated.
As the historical data is far from complete, it is also important to make an assessment of the individual road sections based on their terrain characteristics. Therefore factors such as slope, soil and geology, of the road sections are examined in relationship to landslide frequency and distribution. The return periods of the storm event are analysed based on daily rainfall amounts using the generalized extreme value distribution model. Finally, the landslide susceptibility of the major roads are analysed with spatial multi criteria evaluation (SMCE) based on the available input factor maps: landslide points, slope angle, soil, geology, drainage and land use.
Through this work, the road sections with high landslide susceptibility are identified. Besides, the relation of the landslide occurrences with the triggering rainfall amounts and their return periods are provided. This can help in determining the sections that need further investigation for implementing landslide mitigation measures. Also, the results can be used to identify possible blockage site of the roads due to landslides during storm events.
Use case study area description:
This use case examines the landslide along the main road network in Dominica. Road networks play a crucial role in the development of a country. The economies of Caribbean islands like Dominica are heavily dependent on the tourism industry, an industry for which road infrastructure plays a significant role in transporting tourists from the major hotel areas and cruise ship landing places to other tourist attractions on the islands. However, the road networks are frequently interrupted by landslide and flash flood occurrences along the major roads. In addition, the islands generally have very limited road networks that generally circle the island along the coasts with relatively few connecting roads across the island. Blocking of a road therefore has important consequences as there are no or limited alternatives. For instance, Dominica has an airport located on the other side of the island, as compared to the capital, which is accessible only by one road. This road was recently upgraded, and it is now of good quality except for a number of stretches on the center of the island where active landslides take place, which threaten the road.
Dominica has a volcanic origin with locally very steep and rugged terrain, large areas with tropical forests and a relatively small population (around 72000). Dominica has a rugged and steep terrain in the middle of the islands, with deep-cut valleys and high vertical coastal cliffs alternated with flat and wide valleys, and undulating coastal plains. Due to this, the population is concentrated mostly along the coast. Practically all rocks in Dominica are of volcanic origin, with the exception of a small unit consisting of limestone on the Leeward side. Dominica contains 9 potentially active volcanos, and has experienced a number seismic swarms related to the volcanism in different parts of the island. Dominica is characterized by a humid tropical climate. The rainy season is normally from May to November, when the rainfall intensity is concentrated over a short period which triggers most of the landslides, flooding, and erosion in the study area. Daily rainfall data are available from 2 rain gauges for the period 1982 to 2013, which show that the mean annual rainfall ranges from 1,757 mm in the Canefield station on the western side to 2,622 mm in the Melville Hall station on the eastern side. The annual rainfall ranged from 1,263.2 mm in 2000 to 2,451 mm in 2011 for the Canefield rain gauge, with an average value of 1,757 mm. Dominica is frequently affected by tropical storms and hurricanes, which create severe windstorm, storm surge, flooding and landslide damage. Major events were Edith (1963), David (1979), Klaus (2984), Hugo (1989), Marilyn, Luis Lenny (1995), Dean (2007) and Erika (2015).
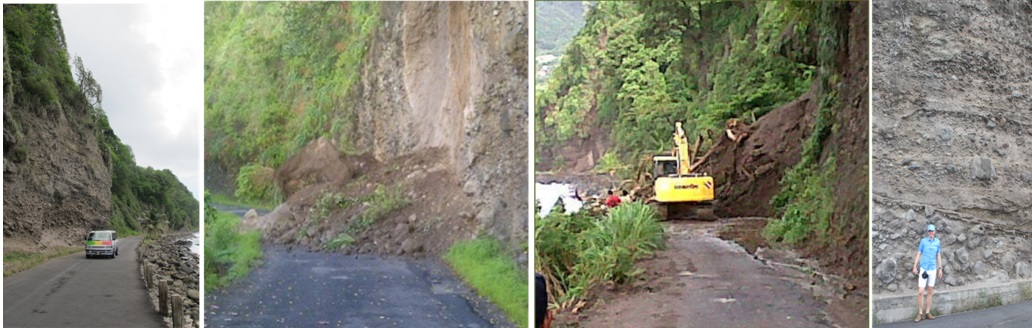
The road network in Dominica is very vulnerable to landslides, due to the steep slopes, weathered volcanic soils and high rainfall amounts. Figure 2 shows one of the main problem areas in the Stowe-Dubuc area along the south coast of Dominica. This stretch of road is bounded by the Atlantic Ocean to the south and steep hill sides to the north making it vulnerable to both landslides and sea surges. It connects the neighbouring communities to the city of Roseau making it an important segment to the road network. Communities in the area are well known for fishing hence making the flow of traffic heavy at certain times of the day. This stretch of road experiences frequent landslides and rock falls during periods of heavy rain. Studies are being planned to evaluate possible mitigation works for this area.
Figure 2: Landslide and rockfall problems in the Stowe-Dubuc area in the SE of Dominica
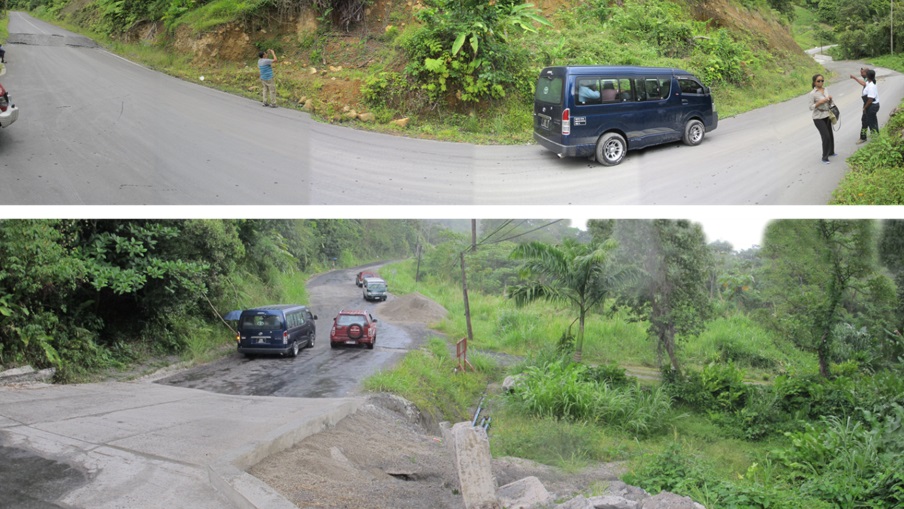
Another notorious problem zone for landslides is the road between Pont Cassé and the Melville Hall airport. This stretch of road has been recently upgraded and new road cuts were made, which are properly designed with terraces, and drainage. Also a number of new bridges were constructed. However there are still two chronic problem areas along this road, where deep seated landslide cause subsidence of the road. Currently there are no structural measures taken to remediate the problems, other than adding new asphalt or concrete to make it possible for vehicles to pass the side scarps. The Ministry of works is monitoring the two movements, hoping they will slow down so that large engineering interventions wouldn't be necessary.
Figure 3: Landslide subsidence along two problem areas along the road from Canefield to Melville hall
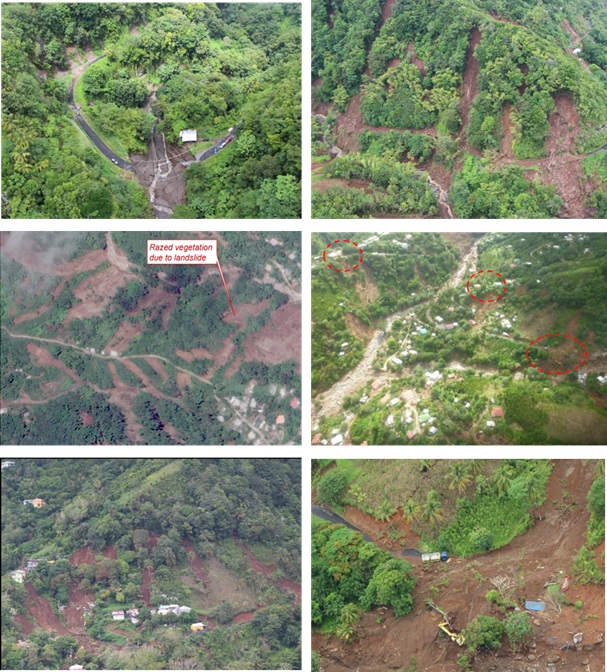
The landslides that were triggered by tropical storm Erika on 27 august 2015 are the latest example of the devastating impact of landslides on Dominica. Landslides happened all over the island, but the largest concentration took place in the Southeast part of the island. The access road in the south of the island from the Plaine is cut off a few hundred meters to the north of Boetica, after the massive rupture of the embankment structure over several tens of meters wide and a height spanning the river (Figure 4). A large number of landslide scars have affected the area above the road (from tens of meters to more than a hundred meters high). The runout zones are between a few meters and several tens of meters wide, with start areas located at different elevations above the road, but mostly starting at the drainage divides. The volumes range from several hundreds to several thousands of m3, with colluvial blocks, scree, weathered material, vegetation debris and various-sized rocks (up to several m3). Most of the settlement areas of Petite Savanne have been more or less severely affected by landslides. To the south of the river that divides Petite Savanne, the area is built over more than 1 km on a narrow ridge line, which have been the origin of a significant number of slides, often starting near the top of the slope. Others started in the lower or middle parts and have the danger of a possible retrogression in the short term (Garnier et al., 2015).
Figure 4: Landslides triggered by tropical storm Erika in the south-eastern part of Dominica. Upper left: road washed out to the north of Boetica; Upper right: access from the south to Petite Savanne - section of the road located after the washed-out bridge; Middle left: section of a satellite image showing the destruction near Petite Savanne; Middle right and lower: landslides in Petite Savanne. Sources: Garnier et al. (2015) and UNITAR-UNOSAT (2015).
Data requirements:
For the analysis of landslide hazard along the road network a number of data layers are required.
Table 1: Overview of input data.
|
Data Type |
Dominica |
|---|---|
|
Satellite images |
Pleiades images (panchromatic and multi-spectral with 0.5 & 2m resolution resp.) from 2014 |
|
DEM |
Contour maps with 10m interval |
|
Geological map |
Available with lithology type |
|
Soil map |
Available with soil types |
|
Landslide inventory map |
Available from Degraff 1987 and 1990 |
|
Landslide data along the road |
Road maintenance and clearance reports from 5 storm events |
|
Daily Rainfall |
2 stations with 31 and 39 years record |
The information related to the satellite images, Digital Elevation Model, geology, and soil maps were already presented in use case 8.3, and the rainfall related data in use case 8.2 so we will concentrate here on the specific data for this use case.
Rainfall data
Rainfall records were available for only two stations: Canefield airport and Melville airport. The records also cover relatively short periods. Canefield airport station is located in the south west part of Dominica, at 15.1 N and 61.24 W coordinates. Records of 31 years, from 1982 to 2013, were available for this station. Melville airport station, on the other hand, has 39 years record that spans from 1974 to 2013. The station is located at 15.32 N and 61.18 W coordinates, in the north east part of the island. Except a few unreadable values which could be a data entering problem, there were no major gaps in the records.
Landslide data along the road
Dominica has limited landslide inventories, only has the latest available inventory that covered the whole area is the one made by Degraff in 1987 and 1990. There is also a work done by Andereck (2007). However, his work only focused on some parts of the island: Grand Fond, Petite Soufriere and Mourne Jaune. Assisted by an engineer from the ministry of works of Dominica, most of the road sections which are affected by frequent landslides were visited during fieldwork. Some of the landslides occurred along the road in previous storm events were identified by taking GPS points and notes on their characteristics. In most of the road sections, however, the areas adjacent to the road are covered with thick vegetation and it was impossible to see or identify landslides on those sections.
Figure 5: Map of damage to road infrastructure by Hurricane David in 1979
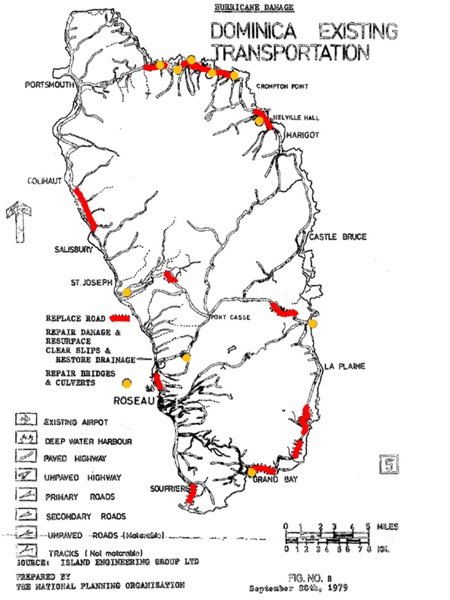
Hurricane David, which occurred on August 29/1979, can be considered as the biggest disaster event that occurred in the last 40 years, resulting in 42 persons killed, around 2000 people injured and 78% of the population was rendered homeless by housing destruction. Almost all the roads and most of the bridges were also damaged by this event. Many roads were blocked by landslides and road communication between the different parts of the country was greatly altered. The preliminary cost estimate for rehabilitation and reconstruction of the roads was estimated to be 82 million east Caribbean dollar, which is about 30 million us dollar with today's exchange rate. The map below shows the roads which were totally damaged and needed replacement and roads blocked by landslides and needed clearance. However, the map is of poor quality and it was not possible to get the related landslide information for this event.
For other events prior to 2009 it was also not possible anymore to reconstruct the landslide information based on road maintenance and clearance reports from the Ministry of Works. Therefore eventually it was possible to make a reconstruction only for five recent rainfall events:
- September 3/2009 (tropical storm Erica),
- October 31/2010 (hurricane Hurricane Tomas),
- September 28/2011 (tropical storm Ophelia),
- November 28/2011, and
- April 17-25/2013.
The reports don't have any spatial references for the landslide locations, they only have the road sections starting and end point where landslide clearance had been done and the amount of money spent for clearance (See example in the Figure below). To locate those areas and prepare them as geo-spatial dataset, the available high resolution images and thematic maps of the island were used. The reports from April 2013 and September 2011 have accompanying pictures of the landslides at the time of their occurrence. An attempt was made to relate these pictures with the pictures taken during fieldwork and locate them by their GPS point. Some of them were easy to relate because their scars were still visible during the fieldwork (See Figure 6 for an example). But for the others, which were vegetated during the field work period, personal judgment had to be taken in looking for some signatures to relate the pictures as shown in the example.
Figure 6: Example of results from few available road clearance reports. Left: example indicating the costs for different sectors. Right: example of photographs of landslides that can still be located today.
![]()
The other three events don't have accompanying pictures; therefore, the information was extracted by taking the starting and end points of the road sections and the number of landslides that occurred in that section together with the clearance cost. In some cases the number of landslides on the sections were not mentioned, only the clearance cost. For such cases, first the average clearance cost per landslide was calculated taking all the five events then estimation was made for the number of slides of those sections without information by dividing their total clearance cost with the average value. Finally a geo-spatial data base for each storm events showing the number of landslides in different road sections of the island were made (See table 2).
Road database
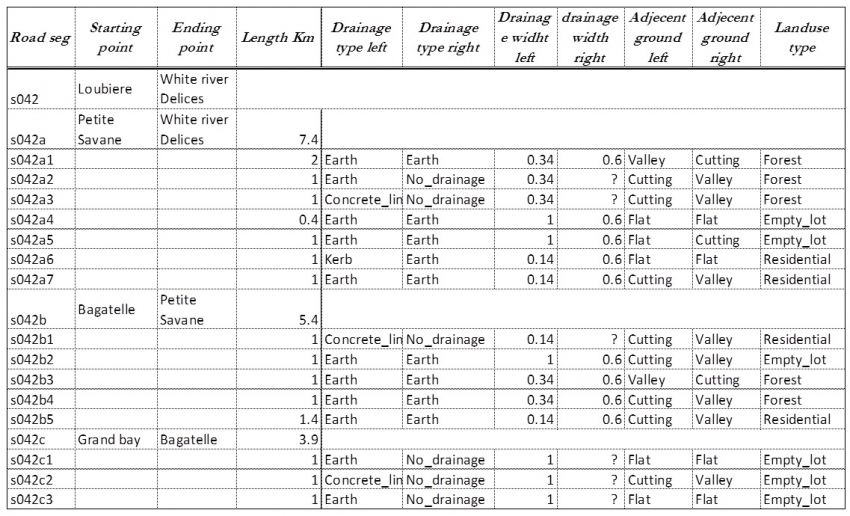
Other than the maintenance and clearance reports, a road data base was also obtained from the Ministry of Works of Dominica. They prepared the road database in 2009 but upgrading of the database has been done every time there was change in the road sections. The road database has information on the entire road network of the country. Among other things, the kind of information obtained from the database include: drainage type and width both in the left and right side of the road, adjacent ground whether it is a cutslope or valley or flat, and land use of the area around the road section. These data are available on average with a 1 km interval. Here also the road sections are indicated only by their starting and end point.
Table 2: Example of a road clearance data in a road segment database.
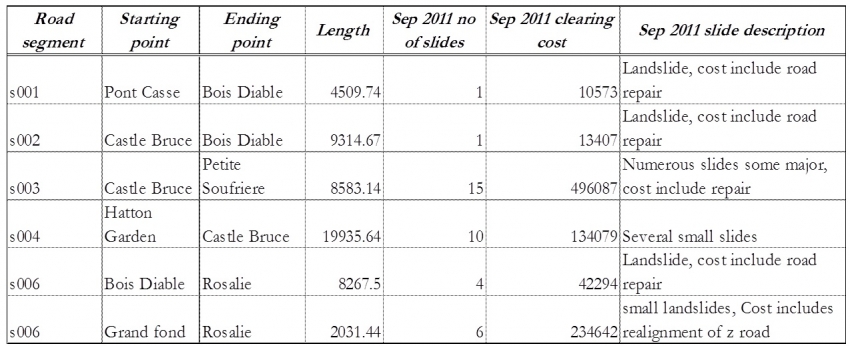
Table 3: Example of a road database.
Analysis steps:
Step 1: Prepare the road database
To transform the road database into a geospatial dataset high resolution imagery together with the location and road network map of Dominica were used. First, the names and location of junction points of the road network were identified using the location map. Then, these points were digitized on the road network map using the high resolution image as a reference. The points were then correlated to the starting and end point information of the road sections provided in the database. After this, the road network was further segmented into 1km interval segments from the starting to end point of each road sections. Finally all the information from the database on each individual road segments were transferred to the respective road segments in road network map. There were some segments with missing data, and it was treated by referring to the images and neighboring segments.
Step 2: Segmentation of the Road sections
Road segmentation and characterization refers to subdividing the entire road network into smaller segments that possess the same spatial characteristics. The road segmentation was developed based on the road database obtained during fieldwork. The database was converted into a geo-spatial dataset, by entering all the information available in the database into the road shape file. As explained above, the shape file has attributes: adjacent ground terrain left and right (whether it is a cutslope, valley or flat), drainage type left and right, and adjacent ground land use. The information from the database were available per one kilometer segments of the road. Due to this, further segmentation of the roads was not possible, instead the 1 km segments were used as a basis to extract the lithology, soil type and slope angle of the road segments.
Step 3: Characterization of the Road sections
The lithology, soil type and slope angle of the one kilometer road segments were extracted from the available geology map, soil map and digital elevation model (DEM) respectively. For this purpose buffer maps along the road network were prepared taking 50 m buffer distances on both sides. For each road segment the upslope side buffer was identified based on the information obtained from the road database and image interpretation. Then, for each road segment the upslope side was selected and the other side was deleted from the buffer map. The buffer map was then crossed with the factor maps. Finally, the geology, soil type and slope angle were assigned for road segments, taking the predominant value (weighted by area) of each of the segment from the crossed tables.
Step 4: Landslide density calculation along the road sections
The landslide density is expressed as the number of landslides per 1 kilometer section of the road. The landslide inventories of the five storm events, prepared using the road maintenance and clearance reports, and the road database were used. First the information on the number of slides per road sections from the landslide inventories were joined to the road database. Then, the length of all each road sections were calculated by excluding the sub-sections where the terrain is flat in both sides. The flat sub-sections were identified based on the high resolution images and the information obtained from the road database. Finally, the number of landslides per kilometer (landslide density) was calculated for each road section by dividing the number of slides by the length of the road section. This was done for all the five storm events separately.
Step 5: Rainfall analysis
For the rainfall analysis we had data from only two stations with a 31-39 years record with some gaps. These stations were analyzed separately and return periods of extreme events were calculated for each. See use case 8.2 for more explanation on this. We also had hourly data for 10 stations arranged in a transect over the country from the DOMEX project, but these data covered a small period of time (from 2007 to 2010), and therefore were not useful for correlating the rainfall with the landslide occurrences. To analyze the distribution of extreme events of rainfall and calculate their return periods, both Generalized Extreme Value (GEV) and Gumbel distribution models were used. Annual daily maximum values of each recording period were calculated for the stations considered. The records were fitted to GEV and Gumbel models using RStudio. RStudio has an extreme value analysis package called "extRemes" . Two functions contained in this package were used for the analysis namely: Fit an Extreme Value Distribution to Data (fevd) and Likelihood-ratio Test (lr.test). The FEVD function can be used to fit the data into GEV distribution model or Gumbel distribution model. As an output, it gives different set of plots such as: QQ and QQ2 plots of the empirical quantiles against model quantiles, histograms of the data against the model density, return level period plots of the return level period against the return period rainfall with 95 percent confidence intervals, etc. The lrLR.test function tests the likelihood ratio of two model fits and indicates which model has a greater fit.
Step 6: Spatial Multi-Criteria Evaluation for landslide susceptibility assessment
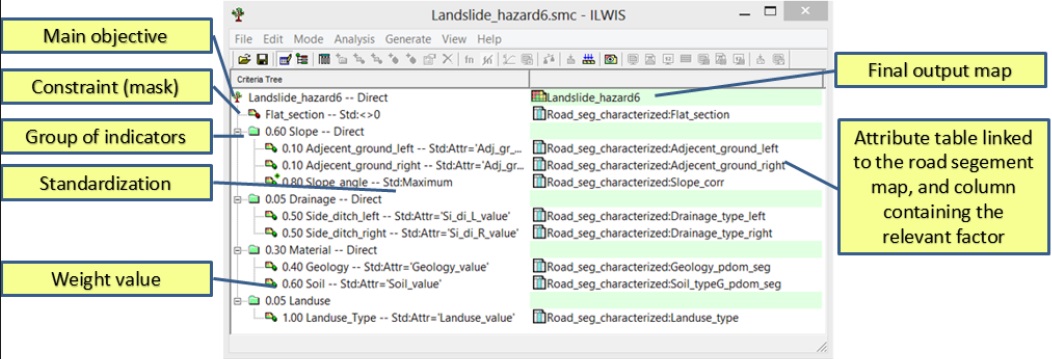
The spatial probability analysis was performed using spatial multi criteria evaluation (SMCE). To formulate the criteria tree, the attributes of the characterized road segment map were used as spatial factors. A criteria tree was generated which contains the indicators used for the analysis of susceptibility in a tree like structure, with groups, sub-groups and individual indicators, which are represented by maps (See Figure . A criteria tree for the road network was prepared using slope, drainage, material and land use attributes as spatial factors. Under the slope factor, slope type of adjacent ground left and right and slope angle were included. Individual indicators were converted to a range between 0 and 1 (which is called standardizing) depending on the relative contribution to susceptibility, as evaluated by experts. For example the slope angle was standardized by dividing the values by the maximum to standardize it between 0 and 1. Another factor was the slope type of adjacent ground, which indicates whether the road segment is a cut, valley or flat section. It was standardized using pair wise comparison, considering that: the class "slope cut" is strongly more important than the class "valley" and very strongly more important than the class "flat", and the class "valley" is moderately more important than the class "flat". Another factor used was drainage type, which included the presence of a side ditch type left and right, with four classes: "concrete lined rectangular", "concrete lined V drain", "kerb" and "no drainage". Also this factor was standardized pair wise, giving the highest importance for "no drainage" and the lowest for "concrete lined rectangular" and "V drain". The group "material" contained spatial factors related to geology and soils. The last spatial factor, land use type beside the road segment, has four types: "residential", "commercial", "forest", "agricultural" and "bare". This factor was standardized by rank ordering, giving the 1st rank for "bare" and the last for "residential and commercial". Here also one attribute was used as constraint to exclude the flat sections from the analysis.
Next the various indicators were compared, using pair wise comparison or rank order methods. This allowed to calculate weights for indicators, and groups of indicators, based on expert judgment. For example, a slope factor group consisted of two indicators: slope steepness (which was given a weight of 0.8) and slope type of adjacent ground was given a weight of 0.2. In weighing of the spatial factors, which was done by direct method, the highest weight was given for slope which is 0.6. Material was given the next higher weight of 0.3. Drainage and land use took equal weight of 0.05. This procedure is subjective, and the weights were assigned by expert judgment, in the absence of more quantitative data that could have been used for a statistical analysis. However, the method allows for group decision making and road engineers could collectively decide how to standardize and weight the individual indicators in future.
Figure 7: Criteria tree for the Spatial Multi-Criteria Evaluation method, used for the qualitative analysis of landslide susceptibility along the road network. The tree contains on the left side the various groups of indicators, with the corresponding maps and linked attribute tables on the right side. The number before the name of the group or the indicator is the weight used, and the words after the name (e.g. Direct, or Std: Maximum) refer to the method used for standardization (conversion of the values to a range between 0 and 1).
Results:
Characterization of road segments
To transform the road database into a geospatial dataset high resolution satellite images together with the road network map of Dominica were used. First, the names and location of junction points of the road network were identified using the location map. These points were digitized on the road network map using the high resolution image as a reference. The points were then correlated to the starting and end point information of the road sections provided in the database. After this, the road network was further segmented into 1 km interval segments from the starting to end point of each road sections. Finally all the attributes from the database on each individual road segment were transferred to the respective road segments in the road network map. There were some segments with missing data, and it was treated by referring to the images and neighboring segments.
The road segmentation shape file has the following attributes:
- adjacent ground terrain left and right (whether it is a cut slope, valley or flat),
- drainage type left and right,
- Adjacent ground land use.
The road data from the database were available per one kilometer segments, and further segmentation of the roads was not possible. The lithology, soil type and slope angle of the one kilometer road segments were extracted from the available geology map, soil map and digital elevation model (DEM) respectively. For this purpose buffer maps along the road network were prepared taking a 50 m buffer distances on both sides. For each road segment the upslope side buffer was identified based on the information obtained from the road database and image interpretation. Then, for each road segment the upslope side was selected and the other side was deleted from the buffer map. The buffer map was then crossed with the factor maps. Finally, the geology, soil type and slope angle were assigned for road segments, taking the predominant value (weighted by area) of each of the segment from the crossed tables.
Figure 8: Road database with information for the individual road segments. The attributes names are given as yellow boxes.
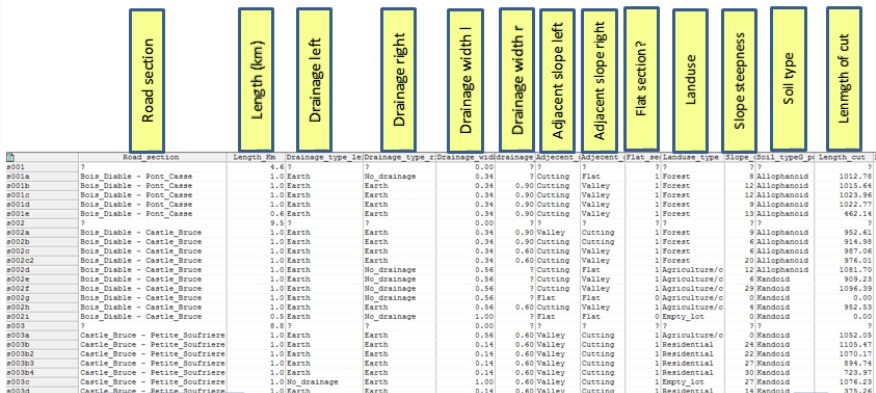
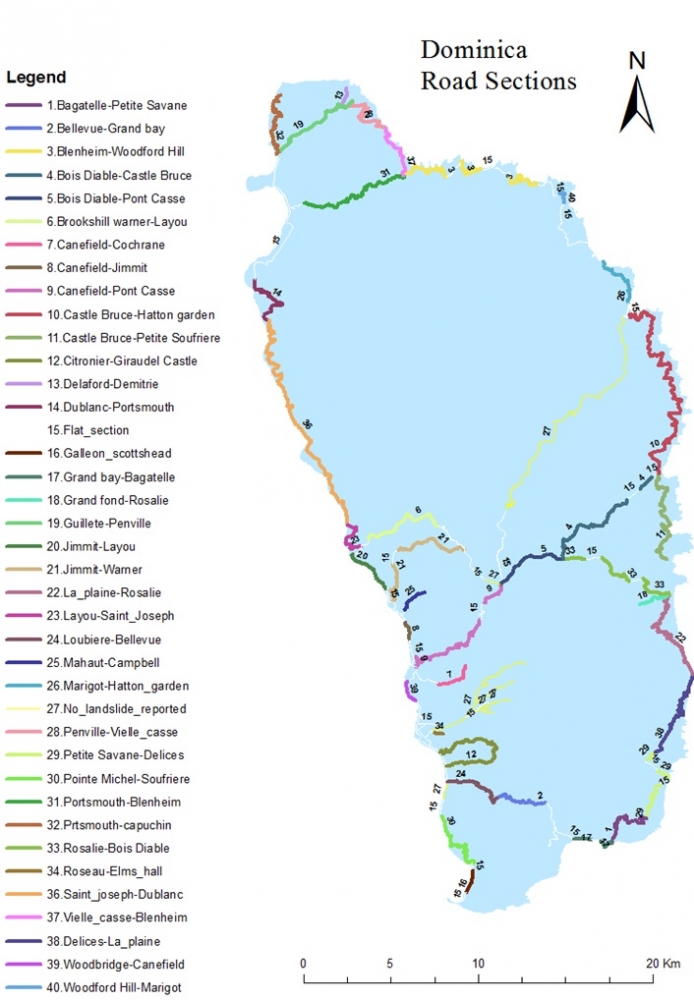
Figure 9: Road sections of Dominica.
Landslide inventories along the road network
It was only possible to collect landslide information along the roads for six storm events: September 2009, October 2010, September 2011, November 2011, April 2013 and August 2015. The last event, tropical storm Erika, occurred after the first version of the susceptibility map was completed. Therefore no field work could be carried out to check the results, and the data are all obtained from two independent studies. One of them is done by UNOSAT (2015) who mapped landslides from TS Erika using high resolution images, and the other was a point inventory carried out by BRGM in 2015 along part of the road network. And the number of landslides reported on these events were 27, 20, 84, 74, 44 and 89 respectively. In each of the events, the number of landslide occurrences reported in different road sections of Dominica were quite different, so are the results obtained from the landslide density analysis. The results are presented below by providing the road sections map accompanied by table showing the landslide density in each of the road sections on the respective storm events.
Figure 10: Landslide locations along the national road network. Left: collected from the archives of the road department and from field work in 2014. Right: landslides along the road caused by tropical storm Erika in 2015.
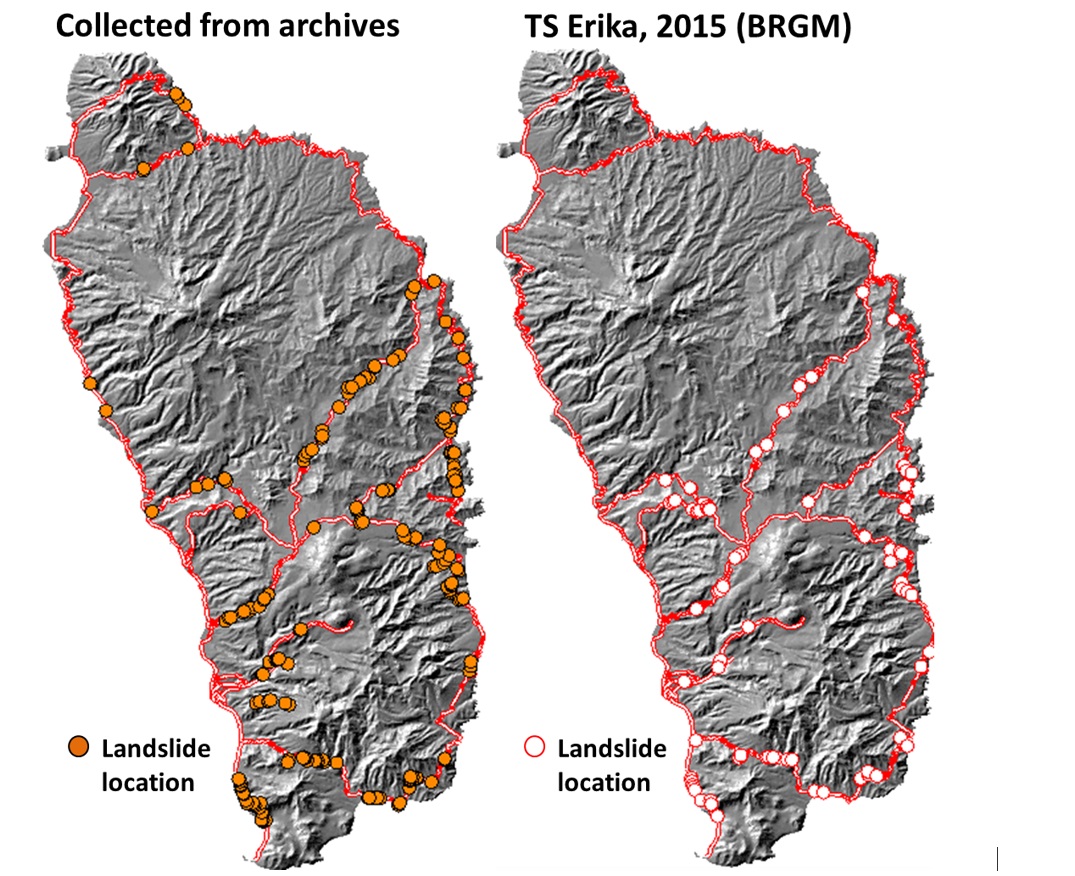
Table 4: Number of landslides along the road sections. Numbers less than 1 indicate that we only got information for the number of landslides over a larger section, and we subdivided this according to the proportional length of the sub-sections.
|
Road Section |
Sept. 2009 |
Oct. 2010 |
Sept. 2011 |
Nov. 2011 |
April 2013 |
Average |
|---|---|---|---|---|---|---|
|
Bagatelle - Petite Savane |
0 |
0.19 |
0.77 |
0.38 |
0.96 |
0.46 |
|
Bellevue - Grand bay |
0 |
0 |
0.12 |
0.37 |
0.12 |
0.12 |
|
Blenheim - Woodford Hill |
0 |
0 |
0.36 |
0.27 |
0 |
0.12 |
|
Bois Diable - Castle Bruce |
0.51 |
0 |
0.13 |
0.76 |
0.38 |
0.36 |
|
Bois Diable - Pont Casse |
0 |
0 |
0.22 |
0 |
0 |
0.04 |
|
Brookshill warner - Layou |
0 |
0.35 |
0 |
0 |
0.71 |
0.21 |
|
Canefield - Cochrane |
0 |
0 |
1.71 |
0 |
0.43 |
0.43 |
|
Canefield - Jimmit |
0.84 |
0 |
0 |
0 |
0 |
0.17 |
|
Canefield - Pont Casse |
0.09 |
0 |
0 |
0 |
0 |
0.02 |
|
Castle Bruce - Hatton garden |
0 |
0.15 |
0.51 |
0.26 |
0.15 |
0.21 |
|
Castle Bruce - Petite Soufriere |
0 |
0 |
1.75 |
0.82 |
0.58 |
0.63 |
|
Citronier - Giraudel Castle |
0 |
0 |
0.10 |
0 |
0 |
0.02 |
|
Delaford - Demitrie |
0 |
0 |
0.85 |
0 |
0 |
0.17 |
|
Dublanc - Portsmouth |
0 |
0 |
0 |
0 |
1.05 |
0.21 |
|
Galleon_scottshead |
0 |
0 |
0.74 |
1.47 |
0 |
0.44 |
|
Grand bay - Bagatelle |
0.95 |
0.48 |
0.48 |
0.95 |
0.95 |
0.76 |
|
Grand fond - Rosalie |
0 |
0.49 |
2.95 |
0 |
0.49 |
0.79 |
|
Guillete - Penville |
0 |
0 |
0 |
1.25 |
0 |
0.25 |
|
Jimmit - Layou |
0.65 |
0.33 |
0 |
0 |
0 |
0.20 |
|
Jimmit - Warner |
0 |
0.26 |
0 |
0 |
0.13 |
0.08 |
|
La plaine - Rosalie |
0 |
0.22 |
0.89 |
0.22 |
0 |
0.27 |
|
Layou - Saint Joseph |
0.92 |
0 |
0.31 |
0 |
0.31 |
0.31 |
|
Loubiere - Bellevue |
0 |
0 |
0.12 |
0.37 |
0.12 |
0.12 |
|
Mahaut - Campbell |
0 |
0.54 |
0.54 |
0 |
0 |
0.22 |
|
Marigot - Hatton garden |
0 |
0 |
0.25 |
0 |
0 |
0.05 |
|
Penville - Vielle_casse |
0 |
0 |
0.89 |
0 |
0.18 |
0.21 |
|
Petite Savane - Delices |
0 |
0.20 |
0 |
0.60 |
0.40 |
0.24 |
|
Pointe Michel - Soufriere |
1.02 |
0.34 |
0.68 |
0.34 |
0 |
0.48 |
|
Portsmouth - Blenheim |
0 |
0 |
0.23 |
1.26 |
0.11 |
0.32 |
|
Prtsmouth - capuchin |
0 |
0 |
0 |
0 |
0.31 |
0.06 |
|
Rosalie - Bois_Diable |
0.46 |
0 |
0.61 |
1.84 |
0.15 |
0.61 |
|
Roseau - Elms_hall |
0 |
3.77 |
5.66 |
0 |
0 |
1.89 |
|
Saint joseph - Dublanc |
0 |
0 |
0 |
0 |
0.12 |
0.02 |
|
Vielle casse - Blenheim |
0 |
0 |
0.69 |
1.15 |
0.69 |
0.50 |
|
Delices - La plaine |
0 |
0.13 |
0.26 |
0.13 |
0 |
0.10 |
|
Woodbridge - Canefield |
3.73 |
0 |
0 |
0 |
0 |
0.75 |
|
Woodford Hill - Marigot |
0 |
0 |
0.36 |
0.27 |
0 |
0.12 |
Based on the known landslide triggering days we selected rainfall data from one of the two rain gauges depending on the nearest location (west or east side of the island). Figure 11 shows, in log-mm scale, the rain that occurred on the day that triggered the landslide (called Rainfall Event, Re) in mm on the y-axis, and the normalized antecedent rainfall (NAR) over 5 days on the x-axis. We have normalized it for the average annual precipitation over 32 years. We were able to use 28 empirical rainfall days for known landslide initiation in Dominica, in a 38-year period (plotted in the figure as orange points). The blue dots represent rain days without reported landslide events. The manually defined threshold in blue represented in the graph is the minimum quantity necessary to trigger a landslide (Guzzetti et al., 2007), and the blurred blue area that bounded the blue threshold is the uncertainty range which was determined visually.
Figure 11: Landslide rainfall threshold for Dominica. RE is the threshold rainfall, and NAR is the 5-day antecedent rainfall; the orange points are the reported landslide events; blue points are the rainfall days without landslides, the blue line is the estimated rainfall threshold; the blurred blue area is the band of uncertainty which was visually identified.
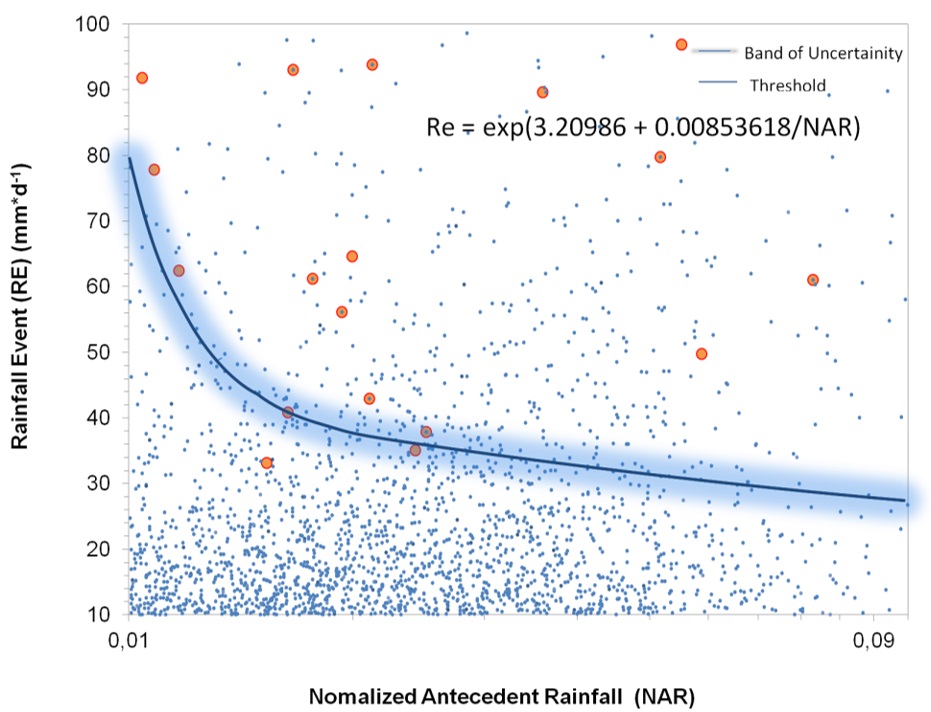
As can be seen in the figure we have plotted both the events where landslides have occurred, and the events that do not have reported landslides. Therefore, while analyzing the result, we have in the area above the thresholds, more false alarms that true alarms. This makes the application of such thresholds rather problematic, for landslide hazard assessment in Dominica given the current availability of data. The poor separation of landslide days from non-landslide days is probably due to several reasons. It could be that the rain (blue dots) which falls above the line took place only around the rain gauge considered and the rest of island didn't receive the same amount rain to trigger landslides. Another reason could be that landslides weren't recorded. And also the orographic effects that play an important role as we saw before are not taken into account.
\Using data from volcanic terrain in Puerto Rico, Larsen and Simon (1993) proposed a threshold relationship between rainfall intensity and duration: I= 91.46D-0.86, where D and I are the duration (h) and the intensity (mm h-1). According to this formula, a rainfall intensity greater than 91.46 mm h-1 over one hour will trigger landslides. If the duration is 13 h, the critical rainfall intensity is 11 mm h-1 with a total amount of 143 mm. Smith et al. (2009) conclude that with no orographic enhancement, the 13 h of accumulated precipitation would have been in the range of 100- 200 mm—close to the landslide threshold. In reality, the actual precipitation on the high terrain exceeded 500 mm—several times the landslide threshold. It is obvious that the orographic effect is important for producing landslides. However, when we are carefully examining the existing landslide inventories, it is also not very evident that the number of landslide increases with increasing elevation on the windward slopes. Orographic enhancement of precipitation must be accounted for in forecasts of landslides.
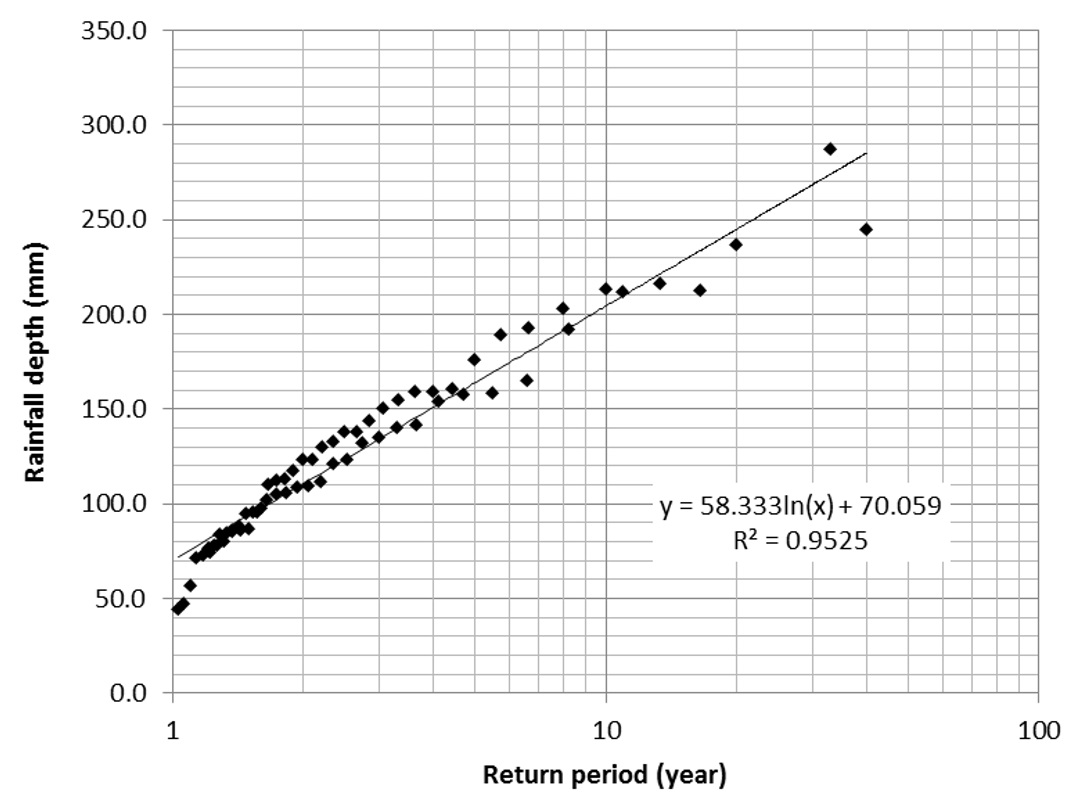
For the frequency analysis we used data from the two rainfall stations: Melville Hall Airport at the eastern side of the island and Canefield Airport at the western side. Melville Hall has generally higher rainfall, although in some years the maximum rainfall recorded is nearly identical, on the same day (or in the same period of 2-3 days). Figure 12 shows that there is some similarity apart from a few very high values at Melville Hall. Because these dominate the Gumbel distribution, a procedure was used to arrive at average values of daily maxima for return periods of 5, 10, 20 and 50 years. Figure 13 shows the two stations in one frequency magnitude analysis.
Figure 12. Comparison of the annual maxima of the two stations (common subset 1982-2013). There is a general agreement but the windward station (Mellville Hall) has much higher values on a few occasions than the Leeward side station of Canefield.
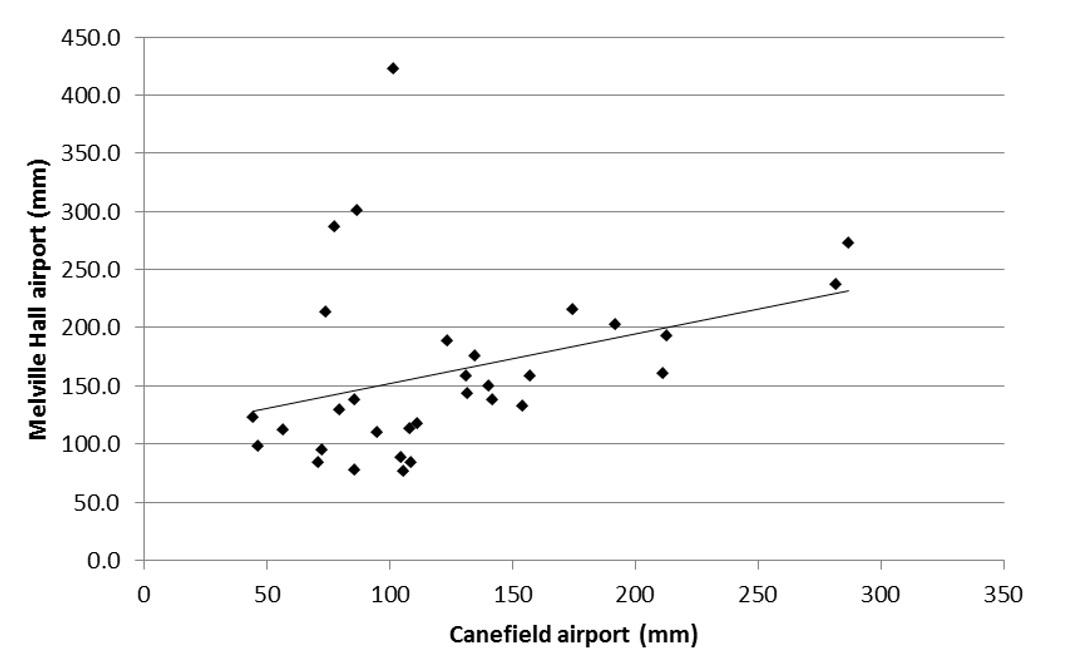
Figure 13. Gumbel analysis of the two stations on Dominica (Melville Hall and Canefield). The average return periods are derived from the log linear fit.
Later on we would like to use this relation of daily rainfall frequency together with the frequency of tropical storms and hurricanes, as a guideline for subdividing triggering events according to the density of landslides they produce. However, the data doesn't allow us to make sound conclusions at this stage, as more data is needed in terms of landslide dates, densities, and rainfall.
Results of susceptibility assessment
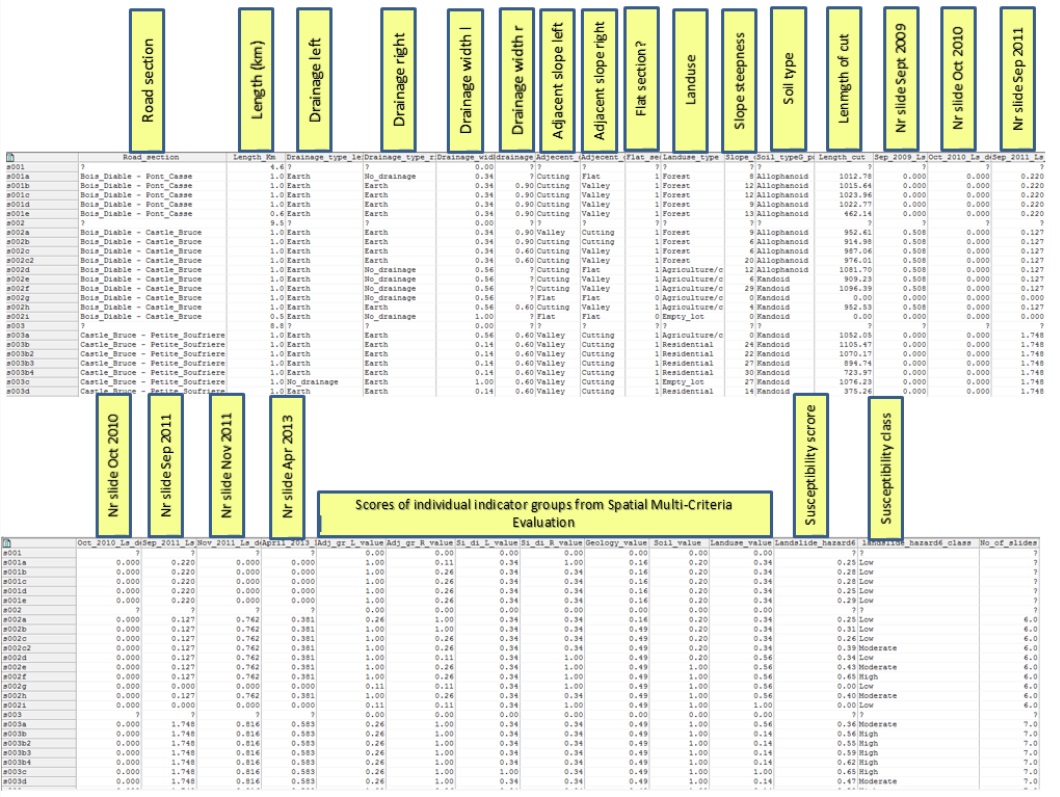
The different indicators were collected from the road segments and the Spatial Multi-Criteria Evaluation was carried out for the road segments. Table 5 gives an overview of the columns generated in this process within the road database. The last column shows the resulting landslide susceptibility.
Table 5: Resulting table from the analysis, with column names indicated in yellow boxes. The upper part contains the input columns from the road database, followed by the characterization of the road segments with the number of landslides for different events, followed by the scores given in the Spatial Multi-Criteria Evaluation and finally the columns with the susceptibility scores and classes.
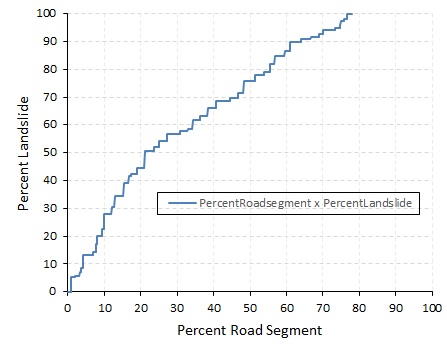
The success rate curve of the susceptibility analysis of Dominica is shown below. As the graph shows, about 60% of the landslides are located in 30% of the road segments with high susceptibility scores. Considering the quality and quantity of the data used for the analysis, this is considered satisfactory, and the best possible, given the limited input data.
Figure 14. Success rate curve of the landslide susceptibility map along the road network.
The results obtained from the SMCE show that the road segments have landslide susceptibility scores ranging from 0 to 0.75 for Dominica, representing road segments from the lowest to the highest susceptibility. To check the validity of the analysis result of Dominica, a success rate calculation was made. The success rate was done using 214 landslide points along the major roads, 71 of these landslides were mapped during field work and the remaining were obtained from the landslide inventory dataset of the whole country presented earlier.
The success rate curve of the susceptibility analysis of Dominica is shown in Figure 14. As the graph shows, about 60% of the landslides are located in 30% of the road segments with high susceptibility scores. Considering the quality and quantity of the data used for the analysis, this is considered satisfactory, and the best possible, given the limited input data.
As the graph shows, about 60% of the landslides are located in 30% of the road segments with high susceptibility scores. Considering the relatively low quality and quantity of the data available for the analysis, we believe this is the best possible so far, although we hope in future such results could be improved when a consistent landslide database would be maintained on the island.
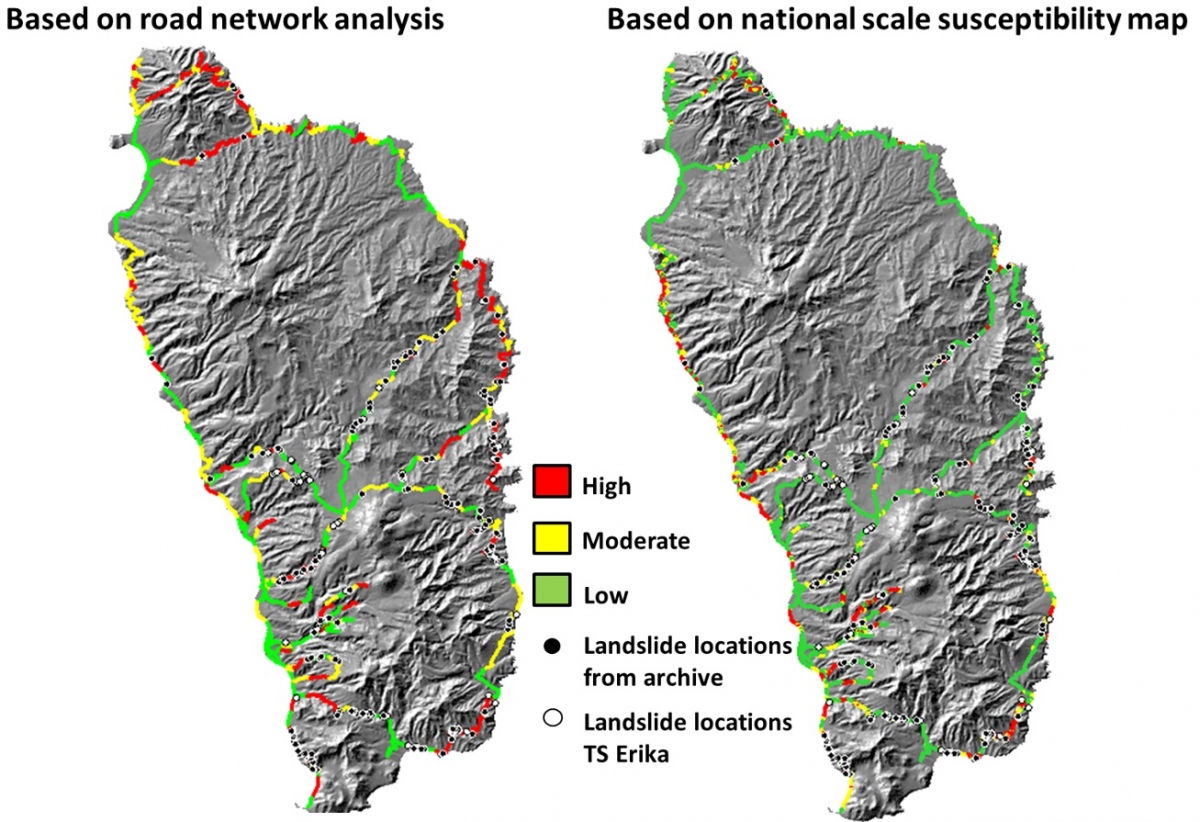
Based on the success rate result, the susceptibility map was classified into three classes of susceptibility level i.e. high, moderate and low. The boundaries of these classes were determined by considering the percentage of the landslides. It was found that 60% of the landslides are located within the high susceptible class, 30% within the moderate class and the remaining 10% within the low susceptibility classes of the road segments. With this classification, 40% of the major road segments fall in the low, 30% in the moderate and the remaining 30% in high susceptibility zones. The landslide susceptibility map along the major roads is shown in Figure 15. In the map, the known previous landslide locations are indicated with black dots.
Figure 15. Left: Landslide susceptibility map along the major roads of Dominica as generated from the road analysis. Right: landslide susceptibility of the road network taken from the national scale landslide map.
Conclusions:
The preparation of the multi temporal landslide inventory maps along the road network was performed using road maintenance reports made during landslide events. This task was supported using image interpretation before and after field work. The field work was concentrated on mapping of landslide locations together with the Ministry of Public Works. For Dominica, road maintenance reports from five landslide events were obtained. From these reports the location and number of landslides occurred in the events were extracted. Even though, it was not possible to get the exact locations of the landslides, the relative location of the landslides in terms of the road sections junction points were extracted. The biggest landslide event in Dominica goes back to 1979 (Hurricane David) and no information on the landslide density or even the amount of rainfall recorded on that event is obtained, which makes it difficult to compare it with the other events. With regard to size, the landslides along the roads are small to medium size. Unfortunately not enough information was available on the landslide sizes to make a statistical analysis of landslide sizes probability. From the analysis it was observed that the islands are prone to landslides even by storm events with two years and three years return periods. Evidently in Dominica only one year was skipped without a reported landslide from 2009 to 2013 and some sections of the road encounter landslides in every of storm events. This indicates that the road sections require a better attention in investigating the main causes and finding long-lasting solution to mitigate the problem than just clearing the roads every time a storm event comes. In this use case we were basically only able to analyze landslide susceptibility using a semi-quantitative approach, resulting in a qualitative judgment of the susceptibility classes. We did the analysis before the occurrence of tropical storm Erika. It is obvious that this event has provided a lot of new data with which the landslide susceptibility map for the road network can be further improved.
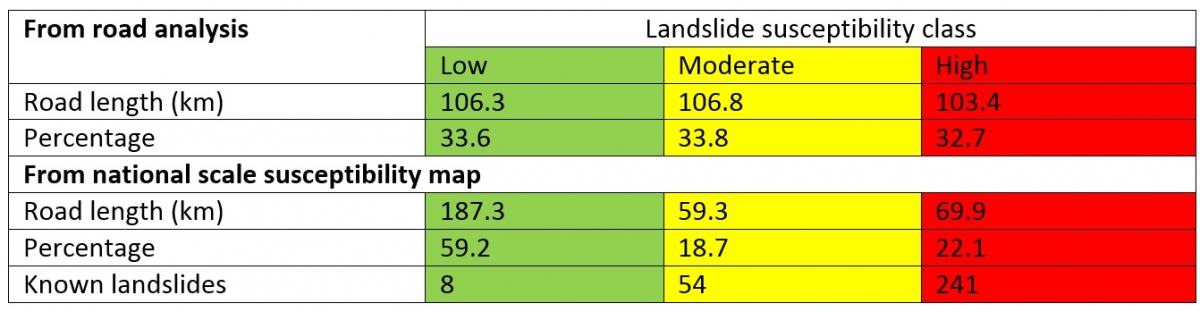
Table 6 provides the summary information for the landslide susceptibility classes for the primary road network. The results show an almost equal percentage of the primary road network in high, moderate and low susceptibility classes. We also combined in GIS the road susceptibility map with the national landslide susceptibility map presented in use case 8.3. From table 6 you can see that there is much more area in the low susceptibility class and that almost all landslides are in the moderate and high classes. This shows that the national scale landslide susceptibility map is better for the road network. Although the method presented here has the potential of being useful on the long run, it is not so reliable still, mainly because of the problems involved in subdividing the road into meaningful segments, characterization of the road and most of all, collection of locations of landslides rather than using the number of landslides along broad stretches of the road, as was the case now. Road maintenance records should be converted into location maps by using GPS in the field during the clearing inspection of roads.
Table 6. Summary information of different landslide susceptibility classes along the road network
References:
Andereck, Z. D. (2007). Mapping Vulnerability of Infrastructure to Destruction by Slope Failures on the Island of Dominica , WI : A CASE STUDY OF GRAND FOND , PETITE SOUFRIERE , AND MOURNE JAUNE. Faculty of Miami University.
Anderson, M. G. (1983). Road-cut slope topography and stability relationships in St Lucia, West Indies. Applied Geography, 3(2), 105–114. doi:10.1016/0143-6228(83)90033-4
Areces-Mallea, A., Weakley, A.S., Li, X., Sayre, R.G., Parrish, J.D., Tipton, C.V., and Boucher, T., 1999. A guide to Caribbean vegetation types: classification systems and descriptions. Arlington, Va., The Nature Conservancy.
Brunsden, D. (1999). Some geomorphological considerations for the future development of landslide models: Geomorphology. 30(1-2), p. 13-24.
Casadei, M., Dietrich, W.E., and Miller, N.L. ( 2003). Testing a model for predicting the timing and location of shallow landslide initiation on soil mantled landscapes: Earth Surface Processes and Landforms. 28(9), p. 925-950.
DeGraff, J. V. (1985). Landslide Hazard on St. Lucia, West Indies. A Report Submitted to the Natural Hazards Pilot Project, Department of Regional Development, Organization of American States, 21.
CEPAL 1979. Report on effeccs of Hurricane David on the island of Dominica. UN Economic and Social Council Rept. 1099
Chacon J, Irigaray C, Fernandez T, El Hamdouni R (2006) Engineering geology maps: landslides and geographical information systems. Bull Eng Geol Environ 65:341–411.
Coan, M., Wood, E., and Reillo, P. (2007). Forest Formation and Land Cover Map Series: Dominica. http://lca.usgs.gov/lca/carland/data/dominica/dominica_lulc_final.tif.htm
Commonwealth of Dominica (2015). Rapid Damage and Impact Assessment Tropical Storm Erika – August 27, 2015. 86 p.
Corominas J, Moya J (1999) Reconstructing recent landslide activity in relation to rainfall in the Llobregat River basin, Eastern Pyrenees, Spain. Geomorphology 30(1–2):79–93. doi:10.1016/s0169- 555x(99)00046-x
Corominas J (2000) Landslides and climate. Keynote lecture- In: Proceedings 8th International Symposium on Landslides, (Bromhead E, Dixon N, Ibsen ML, eds). Cardiff: A.A. Balkema, 4: 1–33
Corominas, J. C.J. van Westen, P. Frattini, L. Cascini, J.-P. Malet, S. Fotopoulou, F. Catani, M. Van Den Eeckhaut, O. Mavrouli, F. Agliardi, K. Pitilakis, M. G. Winter, M. Pastor, S. Ferlisi, V. Tofani, J. Hervas, and J. T. Smith (2014) Recommendations for the quantitative analysis of landslide risk. Bulletin of Engineering Geology and the Environment, V 73, N 2, pp 209–263.
Dahal RK, Hasegawa S (2008) Representative rainfall thresholds for landslides in the Nepal Himalaya. Geomorphology 100(3–4):429–443. doi:10.1016/j.geomorph.2008.01.014
Dai, F.C., Lee, C.F. and Ngai, Y.Y. (2008). Landslide risk assessment and management: an overview . Engineering Geology, 64 (1), 65-87
Das, I., Sahoo, S., van Westen, C.J., Stein, A. and Hack, H.R.G.K. (2010) Landslide susceptibility assessment using logistic regression and its comparison with a rock mass classification system along a road section in the northern Himalayas. In: Geomorphology, 114 (2010)4 pp. 627-637
DeGraff, J.V., 1987a. Landslide hazard on Dominica, West Indies-Final Report. Washington, D.C., Organization of American States.
DeGraff, J.V. 1987b. Geological Reconnaissance of the 1986 landslide activity at Good Hope, D’Leau Gommier, and Belvue Slopes, Commonwealth of Dominica, West Indies, Report submitted to: Commonwealth of Dominica and the OAS
DeGraff, J.V., Bryce, R., Jibson, R.W., Mora, S., and Rogers, C.T., 1989, Landslides: Their extent and significance in the Caribbean, Proceedings of the 28th International Geological Congress: Symposium on Landslides
DeGraff, J.V. 1990a. Post-1987 Landslides on Dominica, West Indies: An Assessment of LandslideHazard Map Reliability and Initial Evaluation of Vegetation Effect on Slope Stability, Submitted to The Commonwealth of Dominica and the OAS
DeGraff, J.V. 1990b, Potential Landslide-Dam Hazard Below Freshwater Lake, Commonwealth of Dominica, West Indies, Report submitted to Commonwealth of Dominica and the OAS
DeGraff, J. V., 1991: Determining the significance of landslide activity: Examples from the Eastern Caribbean. Caribb. Geogr., 3, 31–42.
DeGraff, J. V., 1995, Natural Hazards Vulnerability of the Dominica Hydroelectric Expansion Project: Caribbean Disaster Mitigation Project Final Report, Organization of American States, Washington, DC, 26 p.
DeGraff, J. V., 1997, Technical Assessment of the Landslide-Dam Emergency, Commonwealth of Dominica, W.I.: U.S. Agency for International Development Report, Office of the U.S. Foreign Disaster Assistance, Washington, DC, 24 p.
DeGraff, J.V., James, A. and Breheney, P., 2010. The Formation and Persistence of the Matthieu Landslide-Dam Lake, Dominica, W.I.. Environmental & Engineering Geoscience, Vol. XVI, No. 2, May 2010, pp. 73–89
DeGraff, J.V., Romesburg, H.C., Ahmad, R, and McCalpin, J. 2012. Producing landslide-susceptibility maps for regional planning in data-scarce regions. Nat Hazards (2012) 64:729–749
DeGraff, J. V. and Rogers, C. T., 2003, An unusual landslide dam event in Dominica, West Indies: Landslide News, No. 14/15, pp. 8–11.
DOMEX project. : http://www.domex2011.com/rain-gauge-network
DominicaNewOnline http://dominicanewsonline.com/news/?s=landslide
Fairbridge, R.W., 1975c. Windward Islands. In R.W. Fairbridge (ed.), The Encyclopedia of World Regional Geology, Part 1: Western Hemisphere, p. 667. Stroudburg, Dowden, Hutchinson and Ross.
ECFLA, E. commission for L. A. (Office of the C. (1979). Report on Effect of Hurricane “David” on the Island of Dominica.
Garnier C. and Legendre Y. – coll. Devenoges Q. (2015) – Technical assistance mission to the Government of Dominica - Expertise on land movements following the passage of tropical storm Erika, 26 - 28/08/2015. Final report. BRGM/RC-65203-FR, 67 p., 52 ill., 4 app.
Giannecchini R, Galanti Y, Avanzi GD (2012) Critical rainfall thresholds for triggering shallow landslides in the Serchio River Valley (Tuscany, Italy). Nat Hazards Earth Syst Sci 12(3):829–842. doi:10.5194/ nhess-12-829-2012
Gilleland, E. (2015). Package “ extRemes ” (p. 115).
Guzzetti, F., Carrara, A., Cardinali, M. and Reichenbach, P., (1999). Landslide hazard evaluation: a review of current techniques and their application in a multi-scale study, Central Italy. Geomorphology, 31(1-4): 181-216.
Guzzetti F, Peruccacci S, Rossi M, Stark CP (2007) Rainfall thresholds for the initiation of landslides in central and southern Europe. Meteorol Atmos Phys 98(3):239–267. doi:10.1007/s00703-007-0262-7
Hartford, D., and Mehigan, P.J., 1984, Rain -induced slope failures in the Commonwealth of Dominica, West Indies: 5th International Symposium on Landslides, vol.3, p.87-89
Holcombe, E., & Anderson, M. (2010). Tackling landslide risk: Helping land use policy to reflect unplanned housing realities in the Eastern Caribbean. Land Use Policy, 27(3), 798–800. doi:10.1016/j.landusepol.2009.10.013
Holcombe, E., Smith, S., Wright, E., & Anderson, M. G. (2011). An integrated approach for evaluating the effectiveness of landslide risk reduction in unplanned communities in the Caribbean. Natural Hazards (Vol. 61, pp. 351–385). doi:10.1007/s11069-011-9920-7
IMF, I. M. F. (2006). Dominica: Interim Poverty Reduction Strategy Paper (p. 35). International Monetary Fund. Retrieved from http://books.google.com/books?id=sM2-SF-rPwcC&pgis=1
Jaiswal, P., & van Westen, C. J. (2009). Estimating temporal probability for landslide initiation along transportation routes based on rainfall thresholds. Geomorphology, 112(1-2), 96–105. doi:10.1016/j.geomorph.2009.05.008
Jaiswal, P., Westen, C. J. V., & Jetten, V. (2010). Quantitative assessment of direct and indirect landslide risk along transportation lines in southern India. Natural Hazards and Earth System Science, 10(6), 1253–1267. doi:10.5194/nhess-10-1253-2010
Lang, D.M. 1967. Soil map of Dominica. 2 sheets
Larsen, M. C., and A. Simon, 1993: A rainfall intensity-duration threshold for landslides in a humid-tropical environment, Puerto Rico. Geogr. Ann., A75, 13–23.
Lee, D.-H., Lai, M.-H., Wu, J.-H., Chi, Y.-Y., Ko, W.-T., & Lee, B.-L. (2013). Slope management criteria for Alishan Highway based on database of heavy rainfall-induced slope failures. Engineering Geology, 162, 97–107. doi:10.1016/j.enggeo.2013.04.012
Lindsay, J. M., A. L. Smith, M. J. Roobol, and M. V. Stasuik (2005), Dominica, in Volcanic Hazard Atlas of the Lesser Antilles, edited by J. M. Lindsay et al., pp. 1–48, Seismic Res. Unit, Univ. of the West Indies, St. Augustine, Trinidad and Tobago.
Martin-Kaye PHA (1960) Preliminary notes on the geological map of Dominica. Unpublished progress reports of the Government Geologist 1-12. Geological Survey, Windward Islands.
Mehigan, P.J. & D.N.D.Hartford l-985. Aspects of slope stability in relation to road design in the Commonwealth of Dominica. Proc. llth Internat. Conf. Soil Mech. Found. Eng. L:2339-2343
Mott MacDonald. (2013). Landslide Risk Assessment for Saint Lucia’s Primary Road Network, Hurricane Tomas Rehabilitation and Reconstruction Final Feasibility Report (p. 258). Castries.
O’Keefe, P. and Conway, C. (1977). Natural Hazards in the Windward Islands. University of Bradford, Disaster Research Unit, Occasional Paper Nr, 14. http://www.ilankelman.org/miscellany/BDRU14.pdf
Prior, D.B. and C. Ho, 1972. Coastal and mountain slope instability on the islands of St. Lucia and Barbados. Eng. Geol. 6:1-18.
OAS (1996)History of Storms on Dominica: HURSTAT. Caribbean disaster Mitigation Project. http://www.oas.org/cdmp/document/dominica_waves/2_History/History.htm
Roobol, M. J. and Smith, A. L., 2004, Geologic Map of Dominica, West Indies: Geology Department, University of Puerto Rico at Mayaguez. Electronic document, available at http://www.caribbeanvolcanoes.com/dominica/content/dominicamap.pdf
Rouse, C., 1990. The mechanics of small tropical flowslides in Dominica, West Indies. Eng. Geol., 29:227-239.
Rouse, W.C., A.J. Reading, and R.P.D. Walsh, 1986. Volcanic soil properties in Dominica, tr]est Indies : Eng. Geol . 23: 1- 28 .
Smith, RB, Schafer, P, Kirshbaum, D, Regina, E (2009) Orographic Enhancement of Precipitation inside Hurricane Dean. J. Hydrometeorol., 10, 820-831
Smith, RB, Schafer, P, Kirshbaum, D, Regina, E (2009) Orographic Precipitation in the Tropics: Experiments in Dominica. J Atmos Sci 66, 1698-1716
Soeters, R., Van Westen, C.J., 1996. Slope instability recognition, analysis and zonation. In: Turner, A.K., Schuster, R.L., (Eds.), Landslides, Investigation and Mitigation
SRU 2000, Seismic Research Unit, University of the West Indies. Volcano Hazard Report for Southern Dominica: Interpretation of 1998-2000 Earthquakes and Hazard Mapping Results. 49 pages. http://www.mona.uwi.edu/cardin/virtual_library/docs/1146/1146.pdf
Situation Report #1 - Dominica Flash Flooding and Landslides, April 17- 25, 2013 - Dominica | ReliefWeb. (2013). Retrieved August 06, 2014, from http://reliefweb.int/report/dominica/situation-report-1-dominica-flash-f...
UNITAR-UNOSAT (2015). Landslide Affected Areas in Southeastern Dominica. Product ID: 2281 – English, Published: 1 Oct, 2015, GLIDE: TC-2015-000119-DMA. http://www.unitar.org/unosat/node/44/2281?utm_source=unosat-unitar&utm_m...
USAID, 2006. Development of Landslide Hazard Map and Multi-Hazard Assessment for Dominica, West Indies. United States Agency for International Development (USAID), Caribbean Open Trade Support (COTS) Program. 51 pages.
Van Westen, C. J., Castellanos, E., & Kuriakose, S. L. (2008). Spatial data for landslide susceptibility, hazard, and vulnerability assessment: An overview. Engineering Geology, 102(3-4), 112–131. doi:10.1016/j.enggeo.2008.03.010
Van Westen, C. J., Jaiswal, P., Ghosh, S., Martha, T. R., & Kuriakose, S. L. (2012). Terrigenous Mass Movements. (B. Pradhan & M. Buchroithner, Eds.). Berlin, Heidelberg: Springer Berlin Heidelberg. doi:10.1007/978-3-642-25495-6
Walsh, R.P.D., 1982. A provisional survey of the effects of Hurricanes David and Frederic in 1979 on the terrestrial environment of Dominica, West Indies. Swansea Geog. 19:28 35.
Walsh, R.P.D., 1985. The influence of climate, lithology, and time drainage density and relief development in the volcanic terrain of the Windward Islands. In I. Douglas and T. Spencer (eds.), Environmental change and tropical geomorphology, p. 93-122. London: Allen and Unwin.