

This use case demonstrates the procedure for generating a national landslide susceptibility map , based on a detailed landslide inventory mapping from high resolution satellite images, and field verification, the collection of a series of maps that represent contributing factors to landslide occurrence, an exploratory statistical analysis, and a Spatial Multi-Criteria Evaluation procedure to generate the susceptibility map, which is then validated using success rate curves, and classified into three classes.
Keywords:
Landslides ; susceptibility; inventory; statistical analysis; SMCE; success rate
| Before you start: | Use case Location: | Uses GIS data: | Authors: |
|---|---|---|---|
| Read chapter 4 from the methodology book, and sections 2.4 and 4.3 from the Data Management Book | This use case shows the results from the country of Dominica, and was updated after the 2015 TS Erika event. |
Yes, this use case requires GIS data |
Cees van Westen and Diana Patricia Lozano Zafra |
Introduction:
The windward Caribbean island countries are of volcanic origin, have deep tropical soils, and are exposed to high intensity rainfall events, including tropical storms and Hurricanes. This makes these countries highly susceptible to landslides. They are also relatively small in size and in population, and often lack the expertise to generate landslide inventory and susceptibility maps.
In chapter 4 of the Methodology book the various method for landslide susceptibility and hazard assessment are discussed for the 2 scales relevant on the island (See table below)
|
Level |
Scale |
Type |
Method for |
|---|---|---|---|
|
National |
1:50,000 |
Susceptibility |
Statistical analysis & Spatial Multi-Criteria Evaluation |
|
Local |
1:10,000 |
Susceptibility, hazard in some cases |
Detailed mapping & simple slope stability analysis |
|
Site-investigation |
1:1,000 - 1:5,000 |
Hazard |
Slope stability modelling |
Table 1: Scales of analysis for landslides, with indications whether the analysis will result in susceptibility or hazard maps, and the most appropriate methods that can be applied.
Unfortunately both the historical landslide inventories as well as the spatial factors that should be used for landslide susceptibility assessment are far from complete in most countries. See also the use cases on data management (Chapter 9) and the data management book (chapters 2, 3 and 4). Ideally we would like to generate landslide hazard maps, which show a subdivision of the terrain in zones that are characterized by the expected intensity of landslides within a given period of time, or the probability of landslide occurrence. However, due to limitations in historical landslide data the analysis of frequency-intensity relations is rather difficult, and therefore the resulting map should be called a susceptibility map rather than a hazard map, as it shows a subdivision of the terrain in zones that have a different spatial likelihood that landslides may occur, without a quantitative indication of the relation frequency and density.
This use case addresses the problem of generating national landslide susceptibility and hazard maps in such data poor tropical island environments, with a focus on the island of Dominica. Very extensive multi-temporal image interpretation was carried out to generate landslide inventories, and to corroborate existing inventories (See Use Case 9.3 for more information on this). The quality of the Digital Elevation Models available for Dominica was a major challenge in the process. For Dominica image interpretation was carried out using very high resolution Pleiades images from 2014, and Google Earth images from different periods. The landslide inventories were checked in the field and a database was developed of landslide inventories for different triggering events. Unfortunately it was not possible to generate these inventories for more than 2 different individual triggering events. Existing spatial data related to environmental factors (topography, geomorphology, geology, and soils) were homogenized and new thematic data layers were prepared for the drainage network, geomorphology and land cover.
The landslide susceptibility assessment was carried out in a number of steps. First the importance of the various causal factors was analyzed using statistical modeling with Weights of Evidence (WOE) Analysis. This was done in an iterative process, and new factors were generated and tested. The landslide susceptibility maps were generated using Spatial Multi-Criteria Evaluation (SMCE), where the weights form the statistical analysis were used as a basis, but were modified based on expert knowledge when considered appropriate. Also the effect of different weighting between the factor maps was evaluated. The quality of the resulting landslide susceptibility maps was tested using success rate curves, which were also used to classify the susceptibility map. The final map was made after including the historical landslides and after careful visually checking and simplifying the susceptibility classes.
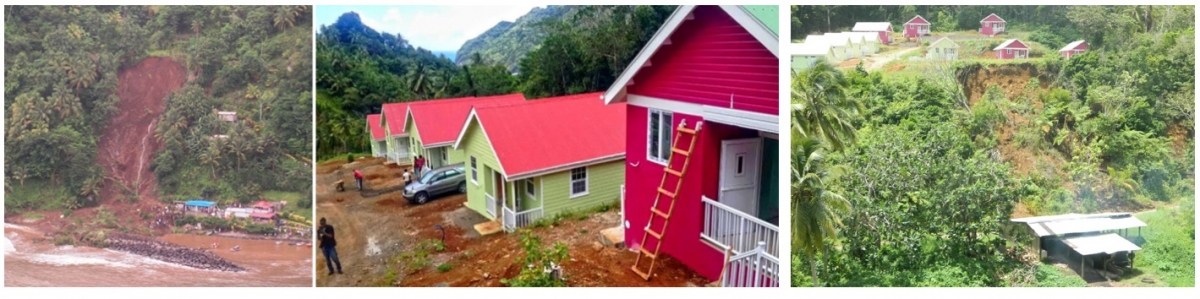
Figure 1: Left: Saint Sauveur landslide which occurred on 24/05/2010 and which killed three people. The government decided to relocate 10 families and with a donation from the Chinese government a resettlement was carried out which was completed in 2015. Right: Landslide damage in the relocation site triggered by tropical storm Erika in August 2015
Objectives:
The main objective of this use case is to generate a national-scale landslide susceptibility map one of the Caribbean islands (Dominica) with suffer severe limitations with respect to the availability and quality of historical landslide inventories and causal factor maps.
This use case explains the procedure used for Dominica. Within the CHARIM project we also generated national landslide susceptibility maps for Saint Lucia, Saint Vincent and Grenada.
Flowchart:
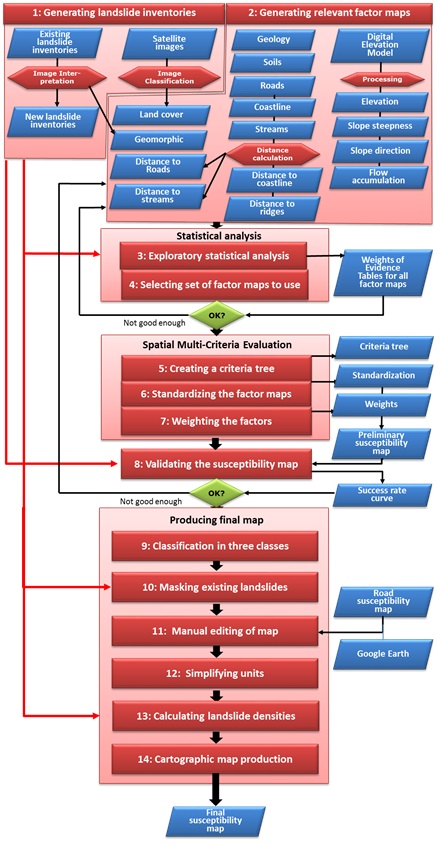
Figure 2: Flowchart of the method used for the national scale landslide susceptibility assessment.
Use case study area description:
The study area for this use case is the island of Dominica, which has a volcanic origin with locally very steep and rugged terrain, large areas with tropical forests and a relatively small population (around 72000). Dominica has a rugged and steep terrain in the middle of the islands, with deep-cut valleys and high vertical coastal cliffs alternated with flat and wide valleys, and undulating coastal plains. Due to this, the population is concentrated mostly along the coast.Practically all rocks in Dominica are of volcanic origin, with the exception of a small unit consisting of limestone on the Leeward side. The geologic units are mostly of volcanic origin and complex, including ignimbrites, lava flows, lahar deposits, and volcanic ashes. All of them are very heterogeneous (vertical and horizontal changes) and have not been mapped in detail for Dominica. Dominica contains 9 potentially active volcanos, and has experienced a number seismic swarms related to the volcanism in different parts of the island. Dominica is characterized by a humid tropical climate. The rainy season is normally from May to November, when the rainfall intensity is concentrated over a short period which triggers most of the landslides, flooding, and erosion in the study area. Daily rainfall data are available from 2 rain gauges for the period 1982 to 2013, which show that the mean annual rainfall ranges from 1,757 mm in the Canefield station on the western side to 2,622 mm in the Melville Hall station on the eastern side. The annual rainfall ranged from 1,263.2 mm in 2000 to 2,451 mm in 2011 for the Canefield rain gauge, with an average value of 1,757 mm . The climate of Dominica is more variable than would seem at first glance. Its location in the trade wind belt would lead to classification as a humid tropical climate. However, the high central peaks modify conditions leading to a highly seasonal climate on the western (leeward) coast and weakly seasonal on the eastern (windward) coast. Dominica is frequently affected by tropical storms and hurricanes, which create severe windstorm, storm surge, flooding and landslide damage. Major events were Edith (1963), David (1979), Klaus (2984), Hugo (1989), Marilyn, Luis Lenny (1995), Dean (2007) and Erika (2015).
Data requirements:
In order to be able to carry out a landslide susceptibility assessment, information is needed on historical landslide locations, and on factors that may be contributing to the occurrence of landslides, such as topographic, geological , land cover, rainfall and soil factors.
Available landslide inventories.
Ideally, as indicated in use case 9.3 on landslide mapping and data management book section 4.3 on landslide inventories, landslide inventory maps should contain information on landslide types, ages, and landslide initiation areas should be separated from the landslide runout areas. The best is to have separate maps for different triggering events.
The historical landslide inventories for Dominica came from the work carried out by J. DeGraff from the US Forest Survey for the OAS in the late 1980's. He carried out detailed image interpretation of landslides using the available black and white aerial photographs, and made a classification of landslide types. It is important to mention that the mapping by DeGraff was not related to a specific triggering event. This landslide inventory was obtained as a shapefiles of points and as a pdf document of the scanned original maps. When analysing the shapefile and comparing it with the pdf, it was noticed that some points were missing and that the points were located in the middle of each landslide. So in order to use these inventories for the landslide susceptibility it had to be complemented and modified placing each point on the scarp area of the landslides. For Dominica, the inventory of 1987 had a total of 900 landslides which were interpreted by DeGraff on black and white aerial photographs from 1984 on scale 1:25.000, and which were classified as Debris Flow (541), Debris Slide (338) and Rockfall or rockslide (20). The landslide inventory made in 1990 comprises of 186 additional unclassified landslides. A landslide inventory map for a small part of the eastern side of Dominica, focusing on the villages of Grand Fond, Petite Soufrie and Mourne Jaune, was carried out in 2007 by Zachary Andereck (Andereck, 2007). He used a Quickbird high resolution satellite image from January 2005 for image interpretation. Field mapping took place in June-July 2006.
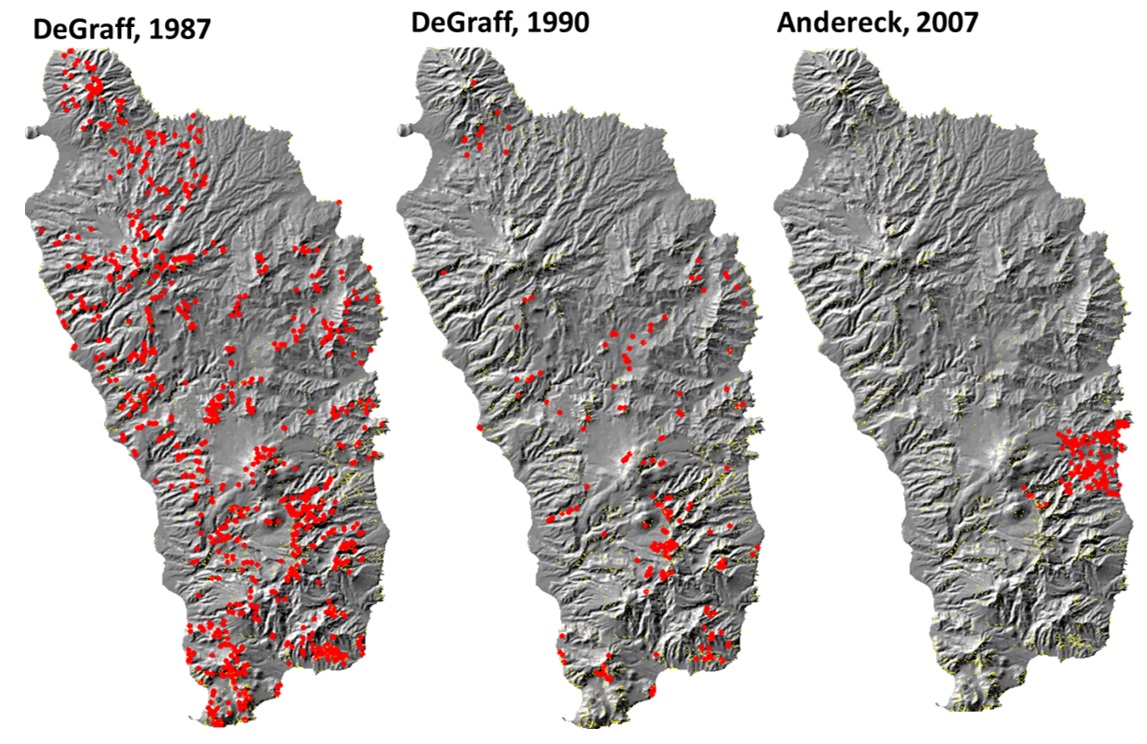
Figure 3: Landslide inventories from 1987 (DeGraff), 1990 (DeGraff) and 2007 (Andereck) that were used in the generation of the final inventory map.
After collecting all available landslide inventories, we also decided to collect landslide inventories ourselves. This was done using image interpretation and field work. Image interpretation played a major role in generating updated landslide inventories.
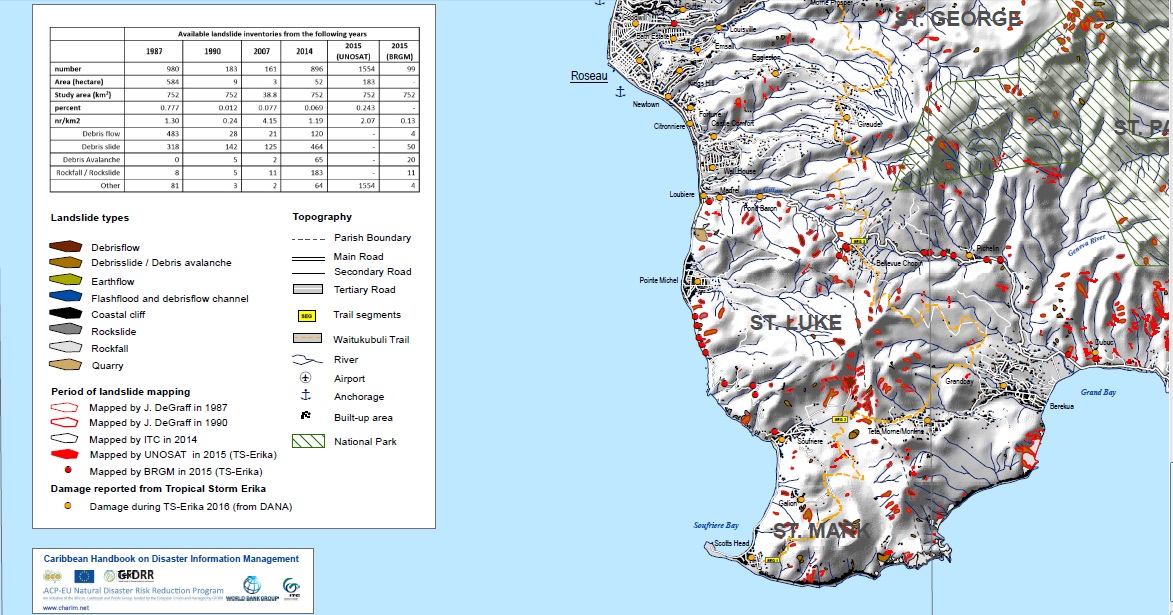
Figure 4: Landslide inventory map generated in this project. For more information see Data management book section 4.3 and use case 9.3.
Available factor maps.
The factors maps for the landslide susceptibility assessment in Dominica is summarized in Table 2.
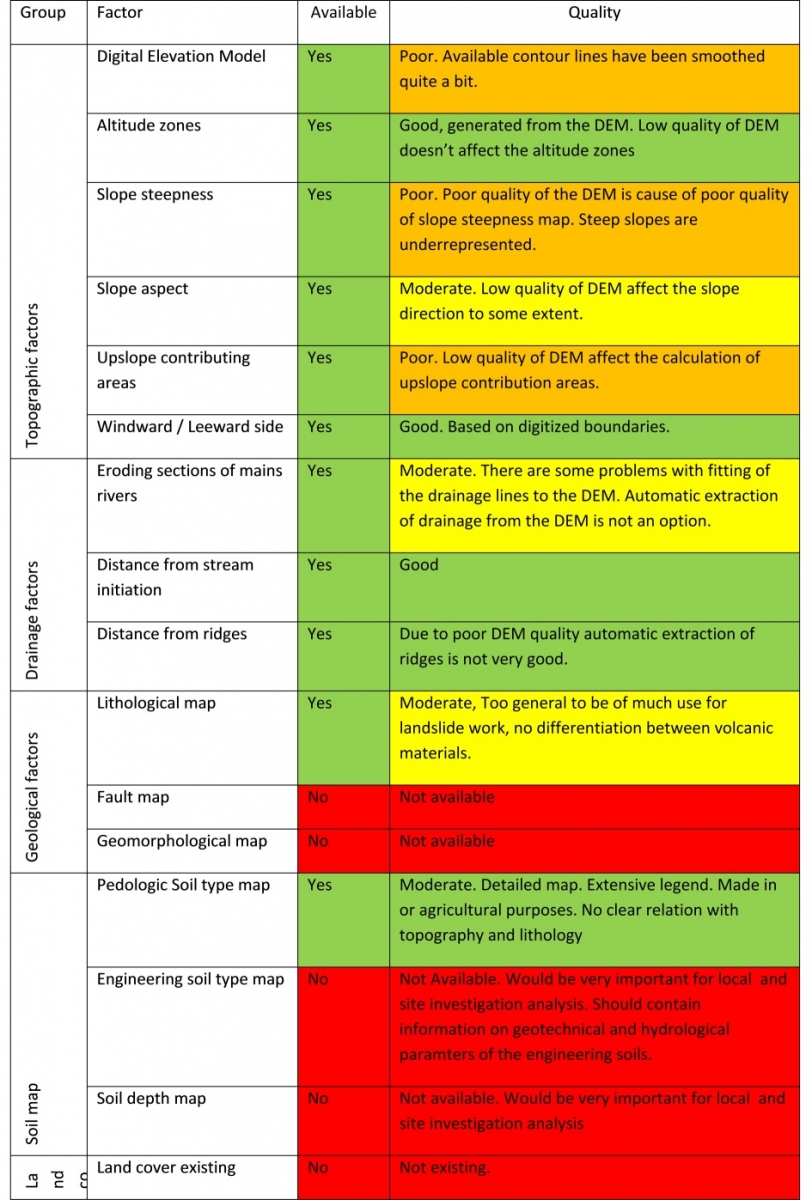
Table 2: Overview of factor maps for landslide susceptibility assessment, with indication of their quality of the data for Dominica.
In the Data Management Book, chapter 2.4 more background information is given on the requirements for the input data for national scale landslide susceptibility and hazard assessment, and chapters 3 and 4 deal with the specific aspects of base data, and hazard related data. Here, only some aspects are illustrated for Dominica. One of the most problematic data layers in Dominica is related to topography. The Digital Elevation Model which is available for Dominica is of very poor quality. It is not clear how this DEM was made and by whom, as we couldn't found any metadata for this data layer. It shows a very high level of smoothing. This can clearly be seen in the figure below, which shows the contour lines (left) and the hill shading image (right).
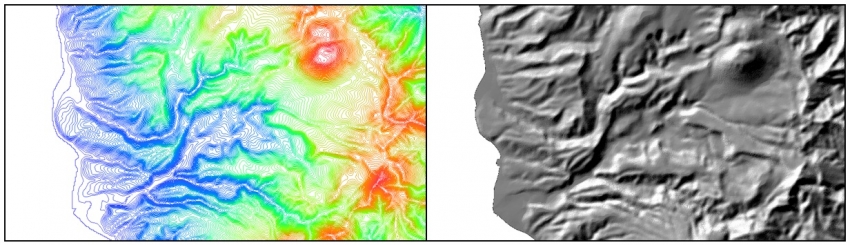
Figure 5: Poor quality of the Digital Elevation Model of Dominica, as the contour lines used for generating it had a very large degree of smoothing. Unfortunately we were not able to find out when and how these contour lines were generated, and by whom.
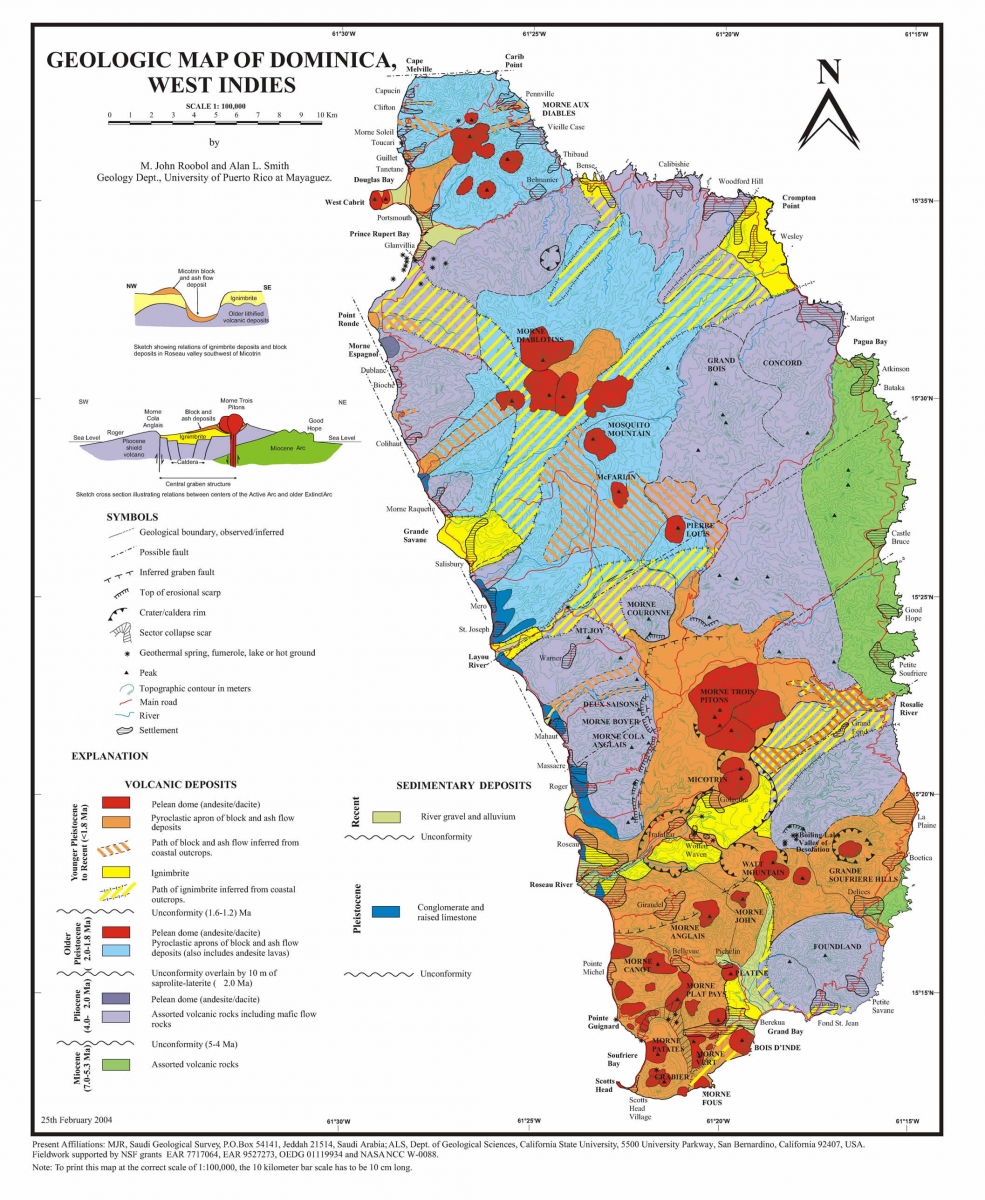
Figure 6: Geological map of Dominica (Roobol and Smith, 2004). Click to enlarge.
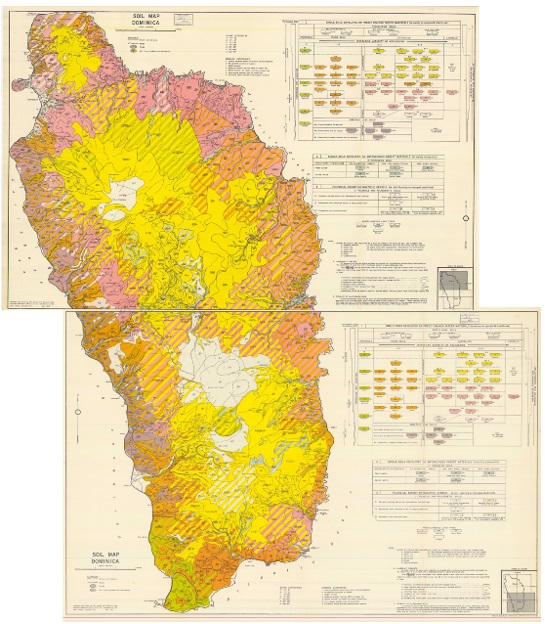
Figure 7: Soil map of Dominica (Lang, 1967). Click to enlarge
The geologic map for Dominica contains only 10 units, subdivided according to its origin (volcanic or sedimentary) and to its age. The units are very general, and generally do not differentiate between lithological units that have a different behaviour with respect to landslides (e.g. lavas and pyroclastic deposits which have different characteristics such as texture, cementation, and strength). The original geological map that we obtained from the department of physical planning had some serious topological errors. In order to overcome problem associated with missing polygons, it was necessary to re-digitize the geology map again.
The available pedologic soil type map was generated in 1967 (Lang, 1967) through physiographic interpretation of aerial photographs, combined with field work and soil testing. The map consists of 2 map sheets, with a very complicated legend. There are over 100 different legend classes, and soils are named after a locality (most often an estate), with a suffix related to the parent material. This classification was made in order to identify agricultural fertility problems. For this the degree of weathering were estimated based on field observation data as pH, texture, structure and X-ray analysis on clay mineral content. Other factors were used as well such as parent materials, climate, plant and animal organisms, age of land and topography. The legend classes show a combination of the soiltype, the slope class and the erosion categories. The conversion of this complicated soil map into a GIS layer turned out to be a major challenge. We obtained a digital soil map from the physical planning department, which contained 17 units. The topology of this map was also problematic, and we had to fix this using a number of GIS operations. We did not attempt to re-digitize the original map, as this would be too time consuming, and also the legend would pose a serious problem in the use of this in the landslide susceptibility assessment. We did link it with a slope class map, to make soil classes in relation to the slope classes, which were considered to be better indicators for slope stability than the soil classes alone.
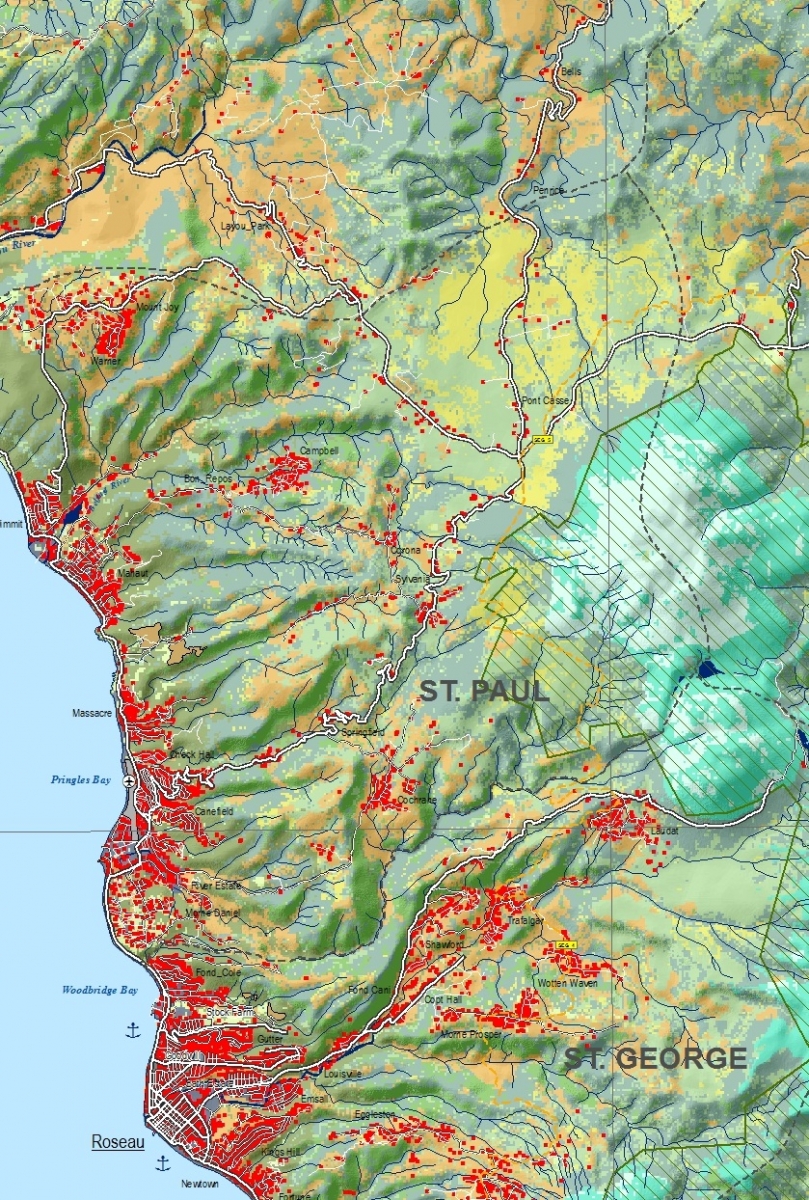
Figure 8 : Land cover map of Dominica (based on Coan, Wood and Reillo, 2007)
Similar problem were encountered with respect to land use / land cover maps. Initially we only obtained a vector-based land cover map without any metadata, so it is not clear how old this map is, who made it, using which techniques. This map is very general when comparing it with a satellite image. The land-use map consists of 18 units. Later on we obtained another land cover map from developed from satellite imagery as part of a multi-organization project. For Dominica, Landsat and SPOT images acquired between 1996 and 1999. A preliminary unsupervised classification was generated to identify areas of distinct spectral characteristics to guide field inspections and the collection of training data (Arces et al., 1999; Coan et al., 2007). Soils and Land cover are determinant for susceptibility assessment. In tropical environments (and in the special volcanic environments) soil layers are very different in their stability characteristics. Landslides have occurred on these soil layers due to their different composition and degree of weathering.
The available road map was adjusted based on a very high resolution satellite image (Pleiades, with spatial resolution of 2 meters multi spectral and 0.5 meter panchromatic). Screen digitizing was done to map the road and make a road classification. Building information was initially only available for Roseau. In order to obtain building data for the entire country, the very high resolution satellite image was used, and thresholds were made for the individual bands. The resulting building mask was converted to polygons, and subsequently to points. The points were edited subsequently manually through screen digitizing using the very high resolution satellite image, and each building in Dominica was digitized using a point. Drainage lines were generated from the Digital Elevation Model and through editing. Place names in Dominica were obtained from an existing dataset, and through available maps and Google Earth. Airports, and other landmarks were digitized using the very high resolution images. Quarries were also mapped from these images.
Analysis steps:
The procedure for landslide inventory mapping is explained more in detail in use case 9.3 and section 4.3 of the Data Management book. In this use case we are focusing on the process of generating the susceptibility map.
As it is described in section 4.2 of the methodology book, there are many different methods for landslide susceptibility assessment (Fell et al., 2008; Corominas et al., (2013)).
In order to select the method it is important to have in mind the size of the study area (754 Km2 for Dominica), the limited amount and quality of the available data, the scale of analysis (with input data ranging in scale between 1:25,000 and 1:50.000, and raster maps with a pixel size of 5 meters) and the experience of the susceptibility analysts.
Because of this, the use of physically-based modeling is not possible, due to the relatively large extension of the study area, and to the absence of parameters such as soil thickness distribution or the geotechnical and hydrological parameters required to carry out physically-based modelling. For a statistical approach we require a sufficiently large landslide datasets related to different triggering events. The current landslides inventories cover a large number of years, during which the causal factors might have changed (e.g. land use/land cover).
The best approach for landslide initiation susceptibility assessment at a scale of 1:25,000 - 1:50000 is the use of statistical methods in combination with expert-based weighting approaches. Since we do not have a very reliable landslide data set, we only used the landslides to check the statistical relation with the factor maps, but generate the actual landslide initiation susceptibility map using Spatial Multi-Criteria evaluation. A combination of statistical methods and expert-based methods should be used, in which the emphasis is on either one of the two, depending on the knowledge of the contributing factors, and the availability of sufficient landslide information.
The procedure was split up in the following steps:
- Step 1: Generation the landslide inventories
- Step 2: Collecting relevant factor maps for landslide occurrence
- Step 3: Exploratory statistical analysis
- Step 4: Selection of the final set of factor maps and generating statistical weights
- Step 5: Creating a criteria tree
- Step 6: Standardizing the factor maps
- Step 7: Weighting the factor
- Step 8: Validation of the susceptibility map
- Step 9: Classification of the landslide susceptibility map
- Step 10: Masking existing landslides
- Step 11: Manual editing
- Step 12: Simplifying units
- Step 13: Calculating densities
- Step 14: Cartographic production of the susceptibility map
Step 1: Generation the landslide inventories
The first, and very important step is to generate a comprehensive landslide inventory. Several landslide inventories were available for Commonwealth of Dominica. However, these are far from complete, and an attempt was made to update these using several sources of information: interpretation of high resolution satellite images, collection of historical information on the dates of occurrence of past landslide events, collection of available data from the national emergency management organisation and from road maintenance records. The resulting landslide inventory map contains many more landslides than were initially available. Landslides were also classified based on their type, and a differentiation was made between initiation and runout areas. The existing historical landslide inventories were integrated into a multi-temporal landslide inventory map , which was made using extensive image interpretation using high resolution satellite images, complemented with historical high resolution images from Google Earth Pro, where the history slicer (allowing to switch to images from different dates) in combination with the relief exaggeration turned out to be very useful for mapping landslide features. All landslide from the historical inventories were checked, and where needed, classified. All other landslides were also classified into landslide types according to Varnes (1984). The polygon-based inventory not only contained landslide initiation areas but also run-out areas, including valleys that had been affected by debris flows and areas that are prone to landslides as quarries, cutslopes and cliffs. Coastal landslides were also mapped. We generated finally two different landslide inventories: one for soil slides and one for mass movements in rock, because these are generally caused by different factors.
Step 2: Collecting relevant factor maps for landslide occurrence
In order to analyze the landslide susceptibility, the factor maps presented in table 3 were used. Before being able to use the maps in the modelling, they had to be homogenized. The available digital maps had different map projections and the outline of the island was quite different. Therefore the maps were converted to the same projection (WGS-84), and in order to clip them to the same area, a mask was used derived from the Digital Elevation Model. Next, the quality was evaluated by overlaying them on each other and evaluating whether the combinations made sense. Topological inconsistencies were removed, and wherever possible the thematic classes were adjusted or improved. For the statistical analysis it is required that the factor maps are class maps, therefore all value related maps were classified into classes as well (e.g. the DEM derivatives).
Step 3: Exploratory statistical analysis
It is necessary to understand the role of the different contributing factors or combinations of factors in order to be able to carry out a landslide initiation susceptibility assessment. There are many methods that could be used for this (See section 4.2 of the Methodology Book). One of these methods is the bi-variate statistical method of Weights of Evidence (WOE) which was used for this use case. In this method, each factor map as well as each landslide inventory was rasterized, and overlayed in a GIS, to calculate the density of landslides within the area occupied by the factor and comparing it with the landslide density in the entire study area. From those comparisons, positive and negative weights (W+i and W−) are assigned to each of the different classes of the factor map (e.g. each geological unit within a geologic map).
Table 3: Overview of the factor maps used for the exploratory statistical analysis for Dominica.
|
Name of factor map |
Explanation |
Classes |
|---|---|---|
|
Coast_dist_class |
Distance from coastline |
8 classes ( 0-50, 50_100, 100_150, 150_200, 200_250, 250_350, 350_500, >500 m |
|
Elevation_Class |
Elevation classes |
6 classes (0 - 100, 100 - 265, 265 - 500 500 - 825, 825 - 1000 , >1000 m.a.s.l. ) |
|
River_dist_cl |
Distance from rivers |
4 classes (0_25, 25_50, 50_100, >100 meter) |
|
Ridge_dist_cl |
Distance from ridges |
8 classes (0-25 , 25_50, 50_75, 75_100, 100_150, 150_200, 200_300, >300 meter) |
|
Road_dist_cl |
Distance from roads |
4 classes (0-2, 25-50, 50-100, > 100 meter) |
|
Geology |
Lithological units |
10 geological units, without clear differentiation between lithological types. Most group several types. |
|
Landuse_map |
Landuse map |
17 classes but still very general |
|
Slope_cl |
Slope steepness classes |
5 classes (0 - 10 , 10 - 20, 20 - 35 , 35 - 50, >50 ) |
|
Aspect_cl |
Slope direction classes |
9 classes (N, NE, E, SE,S,SW, W, NW, Flat) |
|
WindLeeward |
Main parts of the island |
4 classes (windward, leeward, and northern windward & leeward) |
|
Soil_type |
Soil types |
17 main classes, but many subdivision. Very complicated legend |
|
Soil_erosion_class |
Soil erosion classes, indicated in soil legend |
8 simplified classes ranging from very high to very low, and a large class unclassified |
|
Soil_landslide_class |
Soil stability classes, indicated in the soil legend |
10 classes with different problems related to soils from flooding, waterlogging to stability. |
|
Soil_watertable_cl |
Watertable classes, indicated in the soil legend |
6 classes, ranging from perched watertables to deep watertable. |
|
Geology_Slopecl |
Combination of geology and slope classes |
45 classes combining the 10 geological units with 5 slope classes. |
|
Landuse_Slopecl |
Combination of landuse and slope classes |
78 classes combining 17 landuse classes with 5 slope classes. |
|
SoilType_Slopecl |
Combination of soil types and slope classes |
78 classes combining 8 soil classes with 5 slope classes. |
|
WindLee_Slopecl |
Combination of main parts with slope classes |
20 classes, combining 4 classes of exposure with 5 slope classes |
|
Elevation_Side |
Combination of elevation and major directions of the island |
20 classes, combining 4 direction classes with 6 elevation classes |
|
Elevation_Side_Slopecl |
Combination of elevation, exposure and slope steepness |
100 classes, combining 4 direction classes, with 6 elevation classes and 5 steepness classes |
The method was used as an exploratory tool to determine the final input data. Using all the landslide inventories, this procedure was done for each factor map. This procedure also to evaluate:
- How important each factor class is for each landslide inventory and for individual landslide types. It is important to carry out the analysis for major groups of landslides separately and not mix landslide types that have different causal factors (e.g. shallow soil slides and flows, and deep seated rock slides),
- How consistent one landslide inventory is with respect to the others. An analysis should be done about the fact that the inventories have not been created in a homogeneous form throughout the study area. Greater number of events in accessible areas are always reported, so it is possible that all classes of factors that are present near the roads end up being classified as the most susceptible.
- Which landslide inventories should not be used, or should be integrated. For instance it is possible to use point-based or polygon-based landslide inventories, which may have quite different results. Also it is relevant to decide whether to use all landslides from all time periods, or to carry out the analysis for individual time periods, as the causal landslide factors might have changed.
- Which factor maps should be combined into new ones which have a better prediction capability (e.g. Geology combined with slope). For instance it would be better to combine a geologic map with a slope map so that the combination of a weak lithological unit and steep slopes gives a better prediction than using the factor separately.
Step 4: Selection of the final set of factor maps to be used
After analysing the importance of the factor maps and determining the best combination of individual factor maps, and deciding on the landslide inventory that was used, then the statistical analysis was carried out again using the Weights-of-Evidence modelling using the final landslide inventory and final factor maps. This is normally done in an iterative manner. The values obtained from the WOE procedure for the classes of the factor maps were then used as an indication of the weight that should be used in the Spatial Multi-Criteria evaluation (SMCE) for the landslide initiation susceptibility assessment.
Step 5: Creating criteria trees
As was shown already in a number of other use cases, the Spatial Multi-Criteria Evaluation method is also a useful approach in the landslide susceptibility assessment. It combines the expert knowledge, which is always essential in such type of analysis, with factual information derived from the statistical analysis. Due to all kinds of reasons the weights from the statistical analysis should not be taken strictly as they are. The most important reasons are:
- errors in the boundaries of thematic layers, leading to mismatches between landslides and factor classes;
- errors in the thematic content of the layers, leading to strange combinations of landslides and factor classes (e.g. landslides on a beach);
- the thematic map might not be available, and proxies should be used instead;
- uncertainty in exact location of the landslides;
- uncertainty in the classification of landslides
- illogical combinations of factor maps
For implementing the analysis, the SMCE module of the ILWIS software was used. In this method, the expert judgment plays an important role, from the problem definition, till the weighting of the factors within a group and among groups. The analysis starts with the definition of the problem. This step consists on organizing the problem into a criteria tree, with several branches or groups, and a number of factors and/or constraints.
Step 6: Standardizing the factor maps
In order to use Spatial Multi-Criteria Evaluation (SMCE), the factor maps need to be ordered, and standardized inside of the criteria tree. Standardization is the conversion of different types of data (e.g. slope classes, geological units, and distance to roads) into the same range of values between 0 and 1, depending on the importance of the particular data as a factor contributing to landslide susceptibility. In order to decide the final criteria tree to be used to produce the susceptibility map, several different combinations of factor maps were evaluated to find out the best combination of the factor maps for producing the susceptibility map.
After standardizing the factors, the next step is to assign the relative importance of the factors. This is done in different levels. For example if we combine the topographic factors, such as elevation, slope steepness, slope direction and distance from ridges, into one group we have to determine which of these factors is more important than others. We can do this by pairwise comparison, or by ranking the factors. The relative importance of the factor maps was determined by ranking them according to their weights obtained from the statistical analysis, assuming that factors with higher weights (Weights of Evidence) are more important than those with lower weights.
Step 8: Validation of the susceptibility map
In order to validate the susceptibility map we combined the composite index map resulting from the Spatial Multi-Criteria Evaluation with the original landslide inventory map. We then calculated the success rate, which indicates the relation between the percentage of the susceptibility map ordered from the highest to the lowest values, and the percentage of landslides occurring in the locations of these values. We applied different methods for analysing the success rate. For instance we only took the initiation areas of all landslides, or separated the landslides in groups with different types and analysed the success rate for them. When we had landslide inventories from different triggering events we also tested the quality of the map for these different inventories. We also carefully analysed the spatial distribution of the susceptibility values visually in the map by overlaying it with a hill shading image of the country and with the landslide inventory in order to evaluate whether the highly susceptible zones were in accordance with our experience in the field, and with the overall geomorphological situation. When we considered that this relation was not good enough or when the success rate was not good enough (e.g. by applying certain rules such as that 70 percent of the landslides should be located within 30 percent of the map) we decided to go back to the selection of relevant factor maps and repeated the statistical analysis and the spatial multi-criteria evaluation for other combinations of factors. So the landslide susceptibility assessment was an iterative procedure, which was done until we were satisfied with the results. We also discussed the results with a landslide expert (Jerome DeGraff) that was involved in earlier landslide inventory and susceptibility assessments on the island, and also with a group of professionals from the country that visited ITC in the Netherlands during a period of one month in spring of 2015. Based on their suggestions a number of modifications were made.
Step 9: Classification of the landslide susceptibility map
We used the susceptibility value map, and the success rate to subdivide the map in three classes of susceptibility (high, moderate and low). The high susceptibility class has the highest landslide density. The low landslide susceptibility class is used for those areas where landslides are not expected to occur at all, or in very seldom cases. Moderate landslide susceptibility forms the middle class, which should be kept as small as possible.
Step 10: Masking existing landslides
The final map should also contain the areas where landslides have occurred in the past. They should be included in the high susceptible zone, as it is possible that landslides may happen again in these conditions, unless remedial measures have been adopted after the landslide occurrence. Therefore the existing landslide inventories were used and the locations were masked as " high susceptibility" in the map. Zones immediately surrounding these were indicated a " Moderate susceptibility" .
The landslide susceptibility map with the added historical landslides still is in a shape that is too generalized. This is due to the poor quality of the input data, and due to the nature of the analysis method using a combination of statistical analysis and spatial multi-criteria evaluation, which use generalized weights for maps applied to the entire area, whereas there may be exceptions that need to be taken into account locally. Therefore it is important that the final susceptibility map is checked carefully and edited. This is done by exporting the map to an external photo-editing software (CorelPhotoPaint) where it is possible to edit the three classes using the Paint tool. The best is to do this on a dual screen, by comparing the map with a Google Earth image and with a hill shading image overlain with the landslide susceptibility map, plus topographic information, like rivers, roads, buildings etc. This way each part of the area can be visually checked, and the modelled zones of high, moderate and low susceptibility can be adapted, so that they reflect the best situation according to the mapping geomorphologist. If there is a landslide susceptibility map available that is made for the road network, it is also relevant to use this map in editing the final susceptibility map. This is a rather time consuming activity, but it allows to analyse the different parts of the map separately, and therefore obtain results that also are valid for a local scale, and not only for a national scale.
The manual editing of the susceptibility map is also done to simplify the susceptibility units. After running the statistical analysis and spatial multi-criteria analysis, the resulting landslide susceptibility raster map shows many small areas with different degrees of susceptibility. Sometimes the susceptibility differs from pixel to pixel, due to variations in the input maps (e.g. slope classes may differ very locally). In order to be able to use the resulting map as a basis for planning, the area should be subdivided into zones with different likelihood of landslide occurrence. Therefore during the manual editing phases, areas are simplified, and classified into one of the three classes, removing the large local variation. Also after completing the manual editing process, still many locations with isolated pixels remain. These were subsequently removed in GIS using a majority filter. The resulting landslide susceptibility map can also be converted into a polygon map.
Step 13: Calculating densities.
One the final landslide susceptibility map has been obtained, it is now possible to calculate the number of landslides in the three susceptibility classes. This is now not done anymore to validate the map, as the historical landslides were included in the map in step 10, but now the aim is to characterize the susceptibility classes in terms of landslide density (both in area and in numbers). If different event-based inventories are available, it is also possible to calculate landslide densities for each of them, and if also frequency information is available it is also possible to give an indication of the spatio-temporal probabilities (the density of landslides per class for different return periods of the triggering event). It is also possible to calculate the number of exposed buildings and other infrastructure if available. Especially the manual editing in step 11 allows a much more realistic estimation of the exposure.
Step 14: Cartographic map production.
The last step in the procedure was the cartographic production of the susceptibility map. This map was generated using a hillshading map, which is calculating artificial illumination using a filter over the Digital Elevation Model, which was made by interpolating the available contour lines with a resolution of 10 meters. The generation of the individual thematic layers was carried out using the ILWIS software Final map production was carried out using ArcGIS. Also the drainage network, the road network, the buildings, airports, administrative units, names and other relevant topographic information were added in order to make the map better readable. These maps are available as PDF's on the CHARIM webpage. Also the digital versions of the landslide inventories and the landslide susceptibility maps were made available through the GeoNode.
Results:
Landslide inventory map:
The compiled landslide inventory map for Dominica, produced in the beginning of 2015, contained a total of of 2130 polygons. They were classified according to the landslide types, including debris Flow, debris Slide, debris avalanche, rock fall, rockslide, and coastal cliffs with landslides. From those a total of 896 landslides were identified only in 2014, 161 in 2007, 183 in 1990 and 890 in 1987. The landslide inventory was separated into two: one for soil related landslides, and one for rockslides (See figure).
Table 4: Summary of landslide information for the available landslide inventories for Dominica. The numbers indicate new landslides mapped in the various years. * Andereck (2007) only mapped landslides in a small part on the eastern slope of the island
|
Type |
1987 DeGraff |
1990 DeGraff |
2007 Andereck * |
2014 VanWesten |
Total |
|---|---|---|---|---|---|
|
Debris flow |
483 |
28 |
21 |
120 |
652 |
|
Debris slide |
318 |
142 |
125 |
464 |
1049 |
|
Debris Avalanche |
0 |
5 |
2 |
65 |
72 |
|
Rockfall / Rockslide |
8 |
5 |
11 |
183 |
207 |
|
Coastal Cliffs |
0 |
0 |
0 |
47 |
47 |
|
Unknown |
81 |
3 |
2 |
17 |
103 |
|
Total |
890 |
183 |
161 |
896 |
2130 |
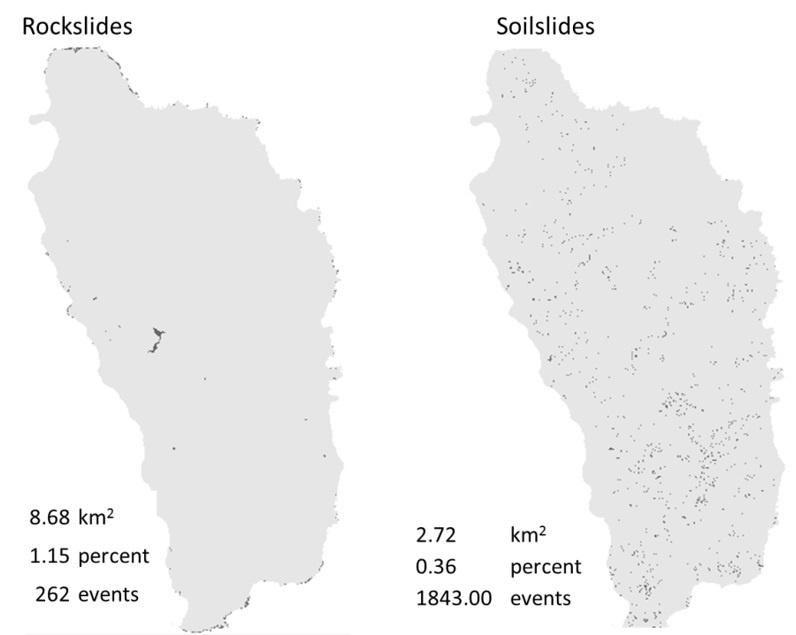
Figure 9: Landslide inventory maps for rockslides and soil-related landslides that were used in the analysis
Results of the statistical analysis
The calculation of the Weights of Evidence is carried out using a script in the ILWIS software. A script contains a series of commands that allow the automatic execution of a series of calculation steps for different maps. The script was analysed for each of the factor maps in combination with two landslide input maps: one for shallow soilslides, and one for rockslides and rockfalls. After running the script a table is made for each factor map with the Weights of Evidence for all classes of the factor map and also the Contrast Factor, which is the absolute difference between W+ and W-. Below some examples are given of the results for topographic factors. The full report on the statistical analysis can be found here.
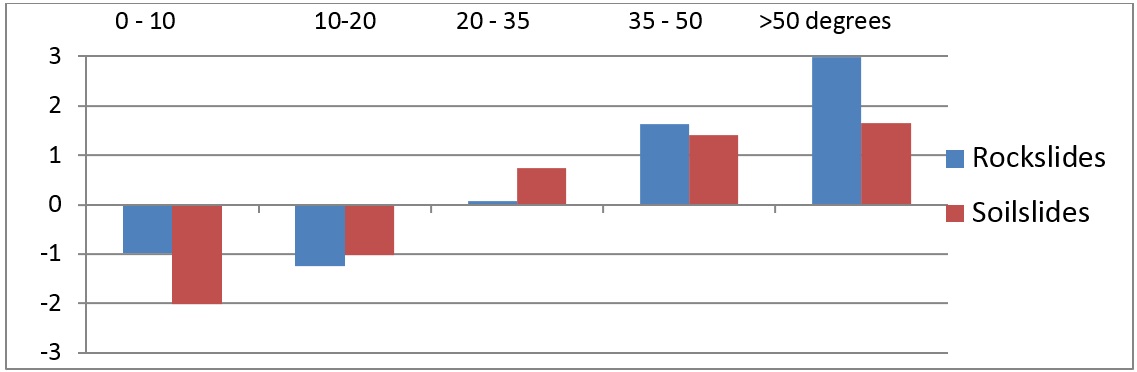
Both rockslides and soil slides show a relation with slope steepness, with negative weights for the lower slope steepness classes, and increasing weights for the steeper slope classes. Both show a similar behaviour although rockslides occur more on very steep slopes.
Figure 10: Contrast factors for slope steepness classes for rockslides and soil slides
When using slope direction directly from the Digital Elevation Model the relation is less clear than when using the major subdivision in windward and leeward sides of the island.
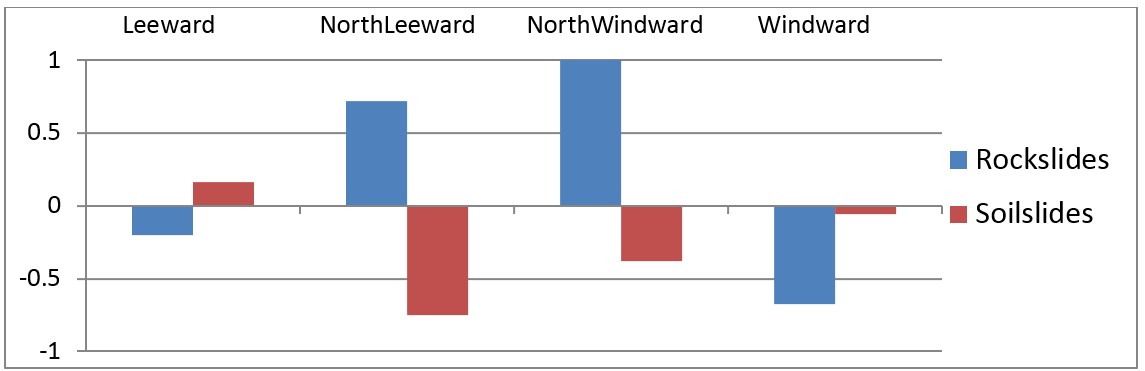
Figure 11: Contrast factors for slope direction classes for rockslides and soil slides.
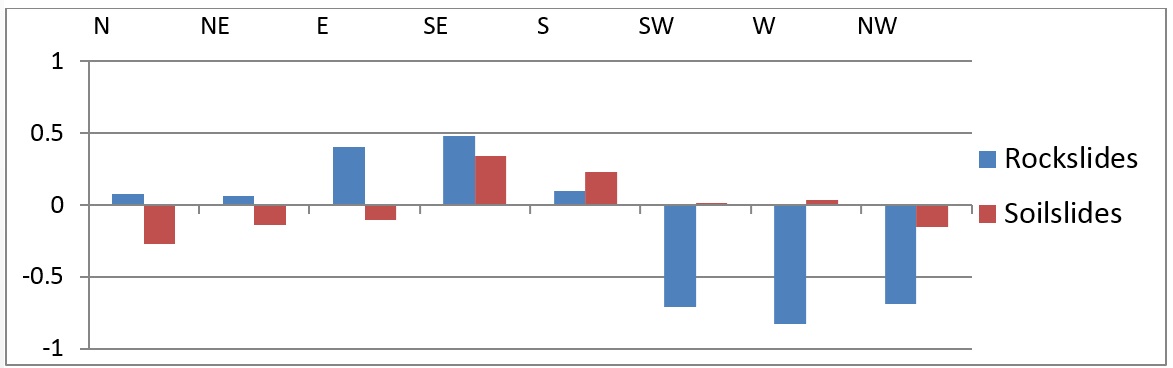
It is interesting to see that rockslides have a quite different relation with respect to slope direction than soil slides. Rockslides occur considerable more on the northern side of the island, both on the windward and leeward sides. The contrast factors for the leeward side is slightly negative and the one for the windward side more negative. According to the statistics, but contrary to the overall impression, soil slides occur relatively more on the leeward side than on the windward side, taking into account the landslide density. This is a bit misleading because of the large areas in the northeast where there are hardly any soil slides, whereas the windward side in the south and south western sides have relatively many landslides.
Figure 12: Contrast factors for main exposure classes for rockslides and soil slides.
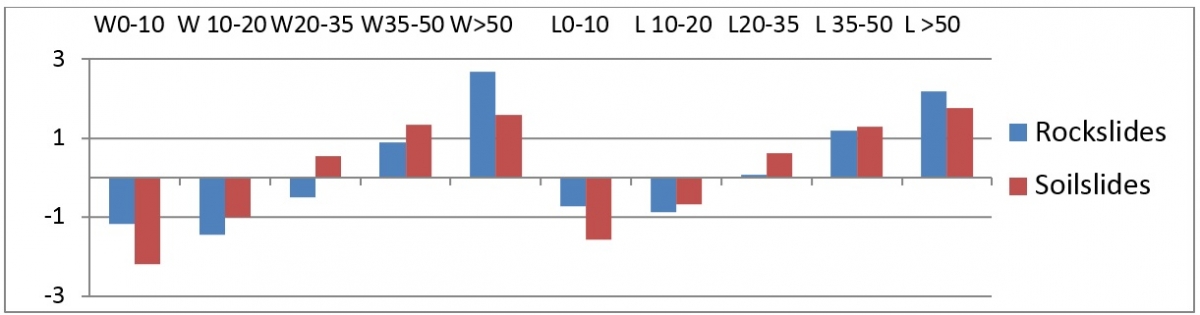
When we combine the main exposure classes with the slope classes and run the statistical analysis for the combination the results show that in both windward and leeward side there is an increase with increasing slope steepness classes. Contrast factors on the windward side are a bit higher for the various slope classes than on the Leeward side.
Figure 13: Contrast factors for the combination of the main exposure classes and slope steepness classes for rockslides and soil slides.
After evaluation all the factor maps and combinations of factor maps, we have drawn conclusion on the usefulness of the various maps for the susceptibility assessment for rockslides and for soil slides. The results are summarized in Table 5.
There is a clear difference between the factor maps that are considered useful for the susceptibility assessment of soil slides and rockslides. Obviously soil-related factors are less useful as factor maps for the analysis of the susceptibility of rockslides, which are much deeper, and where soil type doesn't play an important role as causal factor. The soil related factors are only relatively useful for soil slides as well, as the relations that we obtained through the statistical analysis are often rather confusing. For example the relation with soil erosion hazard classes, soil stability classes, and water table classes do not show what one would have expected, for example that areas with shallow water tables are more prone to landslides. Also the geological map is perhaps more useful as a factor map for the rockslides, which show a clearer relation with the geological units, than the soil slides, as landslides seem to occur in nearly all units. Nevertheless we will use this factor, but only in combination with slope classes, to avoid illogical combinations. We also do the same for other factor maps, such as soil types, and land use types.
The weights obtained from the Weights-of-evidence modelling are a useful indication for the importance of the various factor classes and factor maps. However, the bottom-line is that an expert should be able to explain why a certain factor class contributes to the occurrence of landslides from a process point of view. This is difficult in many cases, and the weights for a given factor class might be actually due to other factors that are related. As the factor maps have problems with positional, thematic, and temporal accuracy and with lineage as well, we do not want to use the weights from the Weights-of-evidence simply as they are, but will adjust them in an expert based method for combining the factor maps, which will be discussed in the next section.
Table 5: Summary of the usefulness of the various factor maps used for the statistical analysis for Dominica.
|
Name of factor map |
Explanation |
Rockslides |
Soil slides |
|---|---|---|---|
|
Coast_dist_class |
Distance from coastline |
Very useful |
Not useful |
|
Elevation_Class |
Elevation classes |
Useful |
Useful |
|
River_dist_cl |
Distance from rivers |
Somewhat useful |
Ambiguous but useful |
|
Ridge_dist_cl |
Distance from ridges |
Not useful |
Very useful |
|
Road_dist_cl |
Distance from roads |
Not useful |
Ambiguous but useful |
|
Geology |
Lithological units |
Useful |
Ambiguous |
|
Landuse_map |
Landuse map |
Somewhat useful |
Somewhat useful |
|
Slope_cl |
Slope steepness classes |
Very useful |
Very useful |
|
Aspect_cl |
Slope direction classes |
Somewhat Useful |
Useful |
|
WindLeeward |
Main parts of the island |
Useful |
Somewhat useful |
|
Soil_type |
Soil types |
Not useful |
Ambiguous |
|
Soil_erosion_class |
Soil erosion classes, indicated in soil legend |
Not useful |
Ambiguous |
|
Soil_landslide_class |
Soil stability classes, indicated in the soil legend |
Not useful |
Ambiguous |
|
Soil_watertable_cl |
Watertable classes, indicated in the soil legend |
Not useful |
Ambiguous |
|
Geology_Slopecl |
Combination of geology and slope classes |
More useful than individual geological units |
More useful than individual geological units |
|
Landuse_Slopecl |
Combination of landuse and slope classes |
Not so very useful |
More useful than individual landuse types |
|
SoilType_Slopecl |
Combination of soil types and slope classes |
Not useful |
More useful than individual soil types |
|
WindLee_Slopecl |
Combination of main parts with slope classes |
Useful |
Useful |
|
Elevation_Side |
Combination of elevation and major exposure units |
Useful |
Useful |
|
Elevation_Side_Slopecl |
Combination of elevation, exposure and slope steepness |
Very useful |
Very useful |
Spatial Multi-Criteria Evaluation results
Based on the results from the statistical analysis (summarized in table 5) which were presented in the previous section, two criteria trees were constructed: one for rock slides and one for soil slides. The selection of the criteria, and the grouping, the standardization of the criteria and the weighing of the individual factors was done iteratively. Each time the resulting susceptibility maps were compared with the existing landslide inventory pattern to evaluate whether the areas representing high susceptible zones were in agreement with the expert opinion derived from the image interpretation of the island. A second method to check the quality of the resulting landslide susceptibility maps was made using the application of success rate curves, which will be explained later. The resulting criteria trees for the generation of susceptibility maps for rockslides and soil slides are shown in the figure below.
Figure 14: Criteria trees used for the susceptibility assessment of rockslides (left) and soil slides (right)
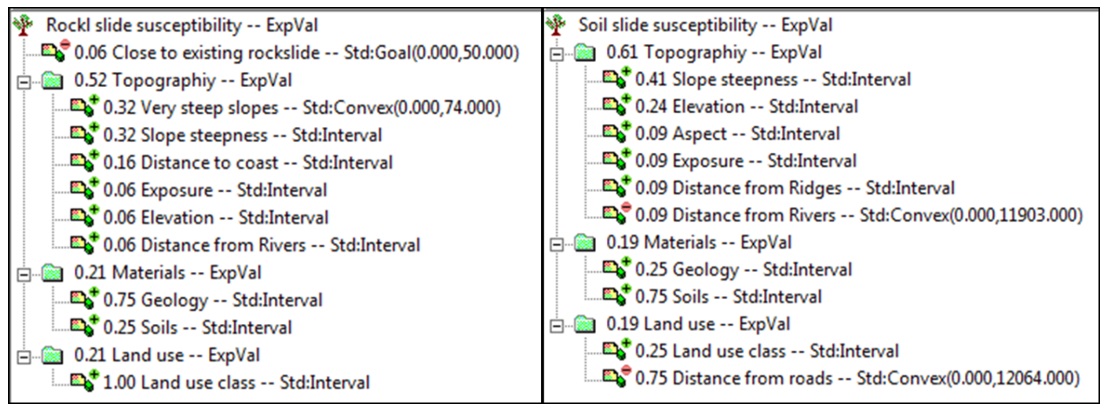
For the criteria selection the results from the bi-variate statistical analysis were leading, however not decisive. For several of the criteria we decided to substitute the weights derived from the statistical analysis with expert-derived weights. Many of the factor maps used are rather poor in quality, and have problems in relation to:
- Positional accuracy: due to digitizing problems and projection problems the boundary lines of some of the maps are not always logical. It was not possible to re-digitize all these factor maps, as we didn't have the original maps and this would also take too much time.
- Thematic accuracy: the actual thematic content of the maps is often problematic. Either the units used are too general (e.g. for the geological map, and the land use map) or are not matching internally with the units from other maps, therefore giving a number of rather illogical combinations. These were removed when assigning weights. However, this may not actually improve the final result, as the maps themselves were not improved.
- Temporal accuracy: the maps may not present the situation under which the landslides actually occurred. This is the main problem for the landuse map, for which we have no metadata, and therefore do not know from which year this map is. The land use situation may have changed considerably since the time the map was made.
Since we are not using the weights of the statistical analysis directly as they were, we didn't separate the available landslide data set into a test data set and a training data set, which is customary in statistical landslide susceptibility assessment. We used all the landslides in the exploratory statistical analysis, in order to be able to get a complete picture of the importance of the various factors classes.
Validation of the resulting maps
In the iterative process of using the Spatial Multi-Criteria Evaluation for the generation of the landslide susceptibility maps, two methods were used to evaluate the quality of the resulting maps:
- Visual inspection of the resulting susceptibility classes in relation with the landslide inventory pattern. We overlaid the landslide inventories for rockslides and soil slides on the respective susceptibility maps and evaluated the patterns. Are most of the landslide on or near to highly susceptible area? If not, what are the factors that occur in these landslides, and could these factors be weighted more without making too much other, currently landslide free areas, also highly susceptible? What are the reasons that some landslides are not in the susceptible zones? This is clearly an iterative procedure, and many runs were carried out using different configurations of the criteria trees in SMCE to adjust the result until an optimal result was obtained.
- The generation of so-called success rate curves. A success rate curve is made by overlaying the susceptibility map (before classification) with the landslide inventory map. The percentage of the susceptibility map with values ranging from the highest to the lowest is plotted on the X-Axis, and the percentage of the number of landslides on the Y-axis. The steeper the curve is and the more it deviates from the diagonal, the better the prediction is.
The resulting success rate curves are shown in the figure below. We have shown two success rate curves for each landslide type. One where we didn't include the proximity to existing landslides as a factor, and one where this factor is also included. Of course it makes sense to assume that areas close to existing landslides are also more prone to future landslides. However, this method will also bias the result as the success rates improve dramatically when this factor is taken into account.
Figure 15: Success rate curves for the susceptibility maps for rockslides (left) and soil slides (right). For both the curves are shown without taking into account the factor " proximity to existing landslides" (red lines) and the ones that do take into account this proximity as a factor (blue curves).
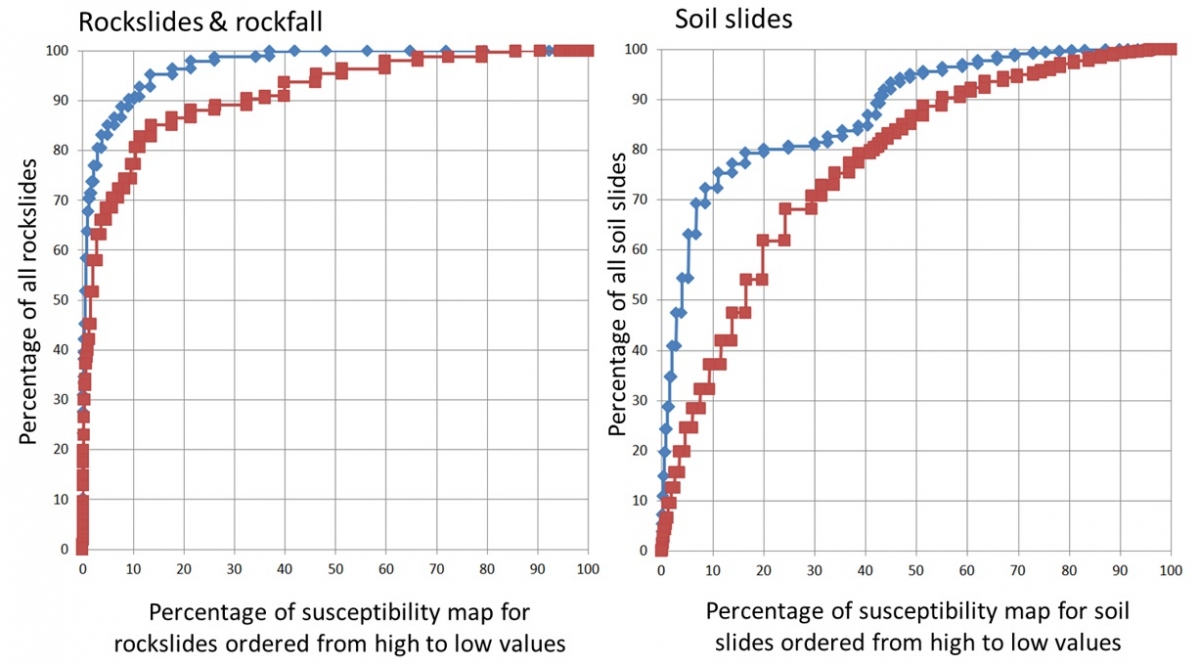
The criteria that were used for subdividing the landslide susceptibility maps are given in Table 6. It is clear that the results for rockslides are better than those for soil slides. However, even these are rather good, with 80% of the landslides in the high susceptibility class, which covers 20% of the island, resulting in a landslide density of 4.6 %.
Table 6: Criteria for subdividing the unclassified susceptibility maps into three classes: high, moderate and low landslide density
|
|
|
Rockslides |
Soilslides |
|---|---|---|---|
|
High susceptibility |
Cut-off value |
0.44 |
0.56 |
|
Percentage of the map |
10 % |
20 % |
|
|
Percentage landslides |
90 % |
80 % |
|
|
Landslide density |
2.84 % |
4.6 % |
|
|
Moderate susceptibility |
Cut-off value |
0.38 |
0.46 |
|
Percentage of the map |
15 % |
25 % |
|
|
Percentage landslides |
7 % |
14 % |
|
|
Landslide density |
0.1 % |
0.58 % |
|
|
Low susceptibility |
Cut-off value |
0 |
0 |
|
Percentage of the map |
75 % |
55 % |
|
|
Percentage landslides |
3 % |
6 % |
|
|
Landslide density |
0.01 % |
0.17 % |
The resulting landslide susceptibility maps for rockslides and soil slides are shown in the Figure.
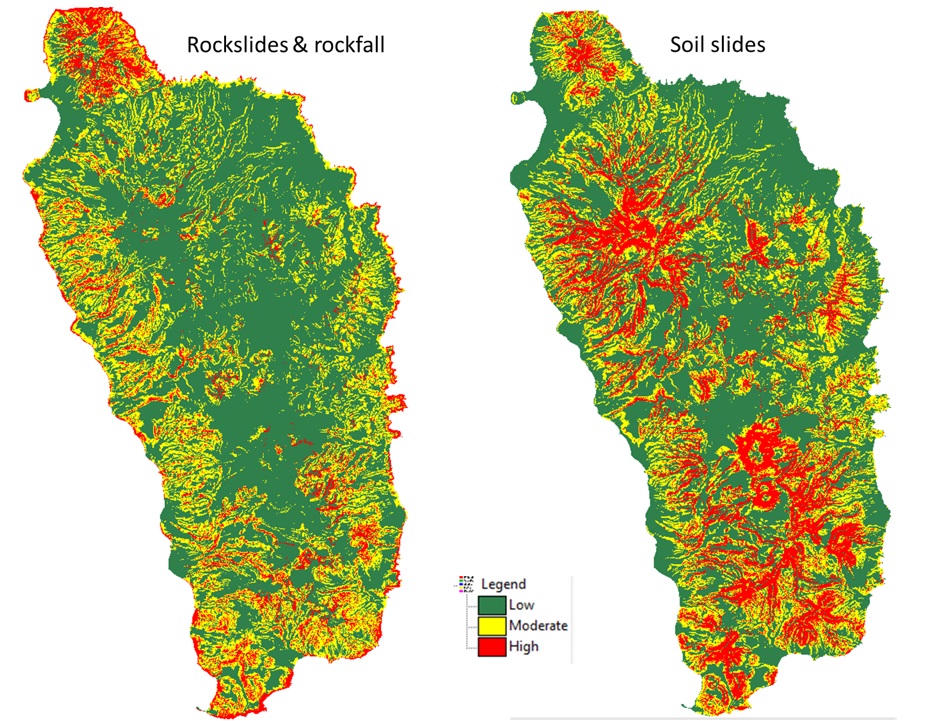
Figure 16: Classified landslide susceptibility maps for rockslides (left) and soil slides (right)
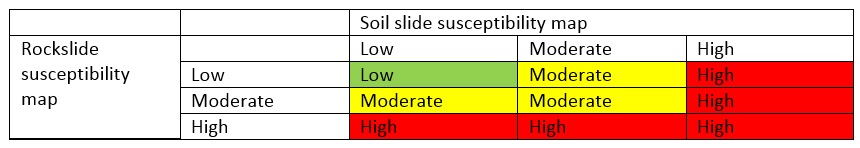
For decision makers it is not useful to have two individual landslide susceptibility maps, because for many of them it would make too much difference whether an area is threatened by soil slides or by rock slides. Therefore we have combined them into one single map, using the following combination table (Table 6)
Table 6: Combination table for generating the final susceptibility map.
The original landslide susceptibility map was generated in June 2015. On 27 August 2015 many landslides were triggered by tropical storm Erika. As can be seen in Figure 16, the landslides had an extremely high density in the southwest part of the country. We checked how many of the landslide occurred in the three landslide susceptibility classes.
Figure 17: Different versions of the landslide susceptibility maps. A: combined soil slide and rockslide susceptibility map; B: overlay of all pre-2015 landslides; C: overlay of the Erika triggered landslides; D: incorporation of landslide inventories in the susceptibility map; E: final landslide susceptibility map generated after extensive editing
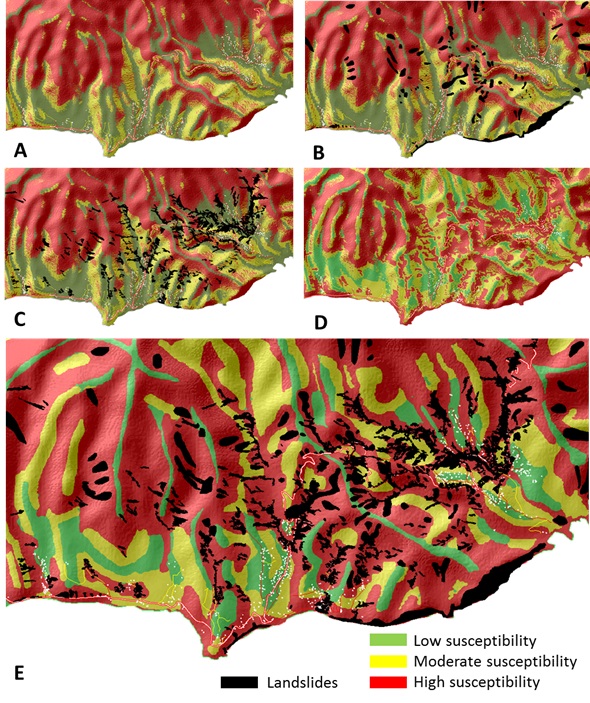
In order to improve the final map we masked with GIS all historical landslides in the susceptibility map as class " high" , as it is possible that landslides may happen again in these conditions, unless remedial measures have been adopted after the landslide occurrence (See Figure 17 D). The next step was to carefully check and edit the susceptibility map. This was done by exporting the map to an external photo-editing software (CorelPhotoPaint) where it is possible to edit the three classes using the Paint tool. We did this using a dual screen, by comparing the map with a Google Earth image and with a hill shading image overlain with the landslide susceptibility map, plus topographic information, like rivers, roads, buildings etc. This way each part of the area was visually checked, and the modelled zones of high, moderate and low susceptibility were adapted when necessary, so that they reflect the best situation according to the mapping geomorphologist. This was a rather time consuming activity, but it allowed to analyse the different parts of the map separately, and therefore obtain results that also are valid for a local scale, and not only for a national scale. The manual editing of the susceptibility map was also done to simplify the susceptibility units (See Figure 17 E). After running the statistical analysis and spatial multi-criteria analysis, the resulting landslide susceptibility raster map shows many small areas with different degrees of susceptibility. Sometimes the susceptibility differs from pixel to pixel, due to variations in the input maps (e.g. slope classes may differ very locally). In order to be able to use the resulting map as a basis for planning, the area should be subdivided into zones with different likelihood of landslide occurrence. Therefore during the manual editing phases, areas are simplified, and classified into one of the three classes, removing the large local variation. Also after completing the manual editing process, still many locations with isolated pixels remain. These were subsequently removed in GIS using a majority filter. The resulting landslide susceptibility map can also be converted into a polygon map.
Once the final landslide susceptibility map was obtained, we recalculated the number of landslides in the three susceptibility classes. The results is shown in Table 8.
Table 8. Summary information of different landslide inventories within the low, moderate and high susceptibility classes of the final landslide susceptibility map for Dominica
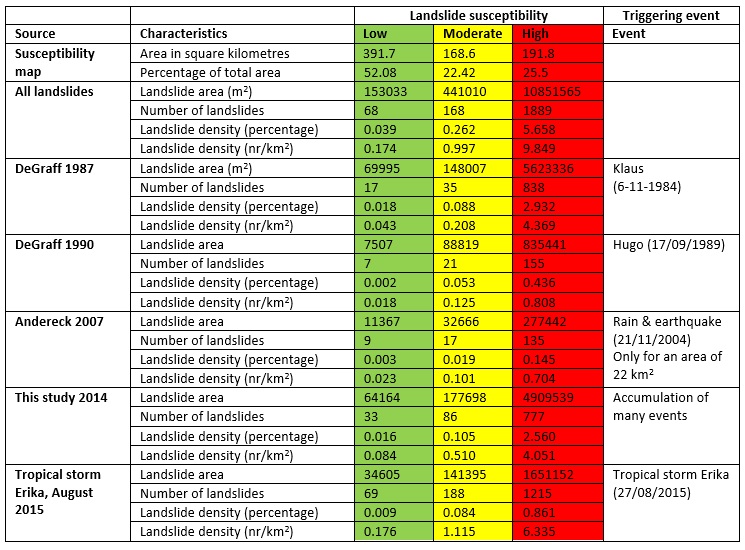
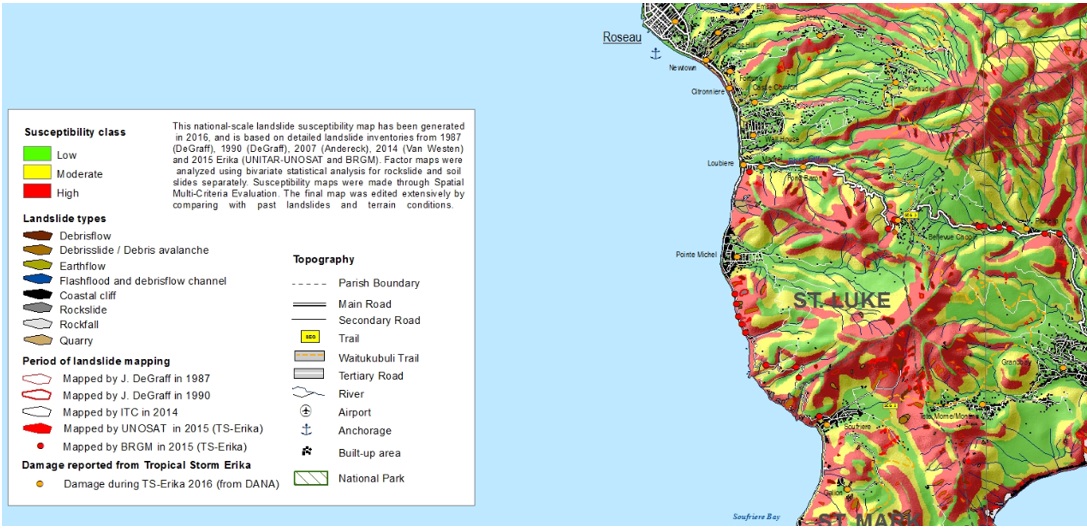
Figure 18: Legend of the final landslide susceptibility map for Dominica, and enlarged example of the Southwestern part. Click to see the full map The full map can be downloaded as pdf from here
Conclusions:
- We generated a new database of disaster events for Dominica using all available data, making use of many different sources. This is the most complete inventory up to our knowledge.
- We also compiled all available landslide data from different sources, which was not an easy task. We had to digitize some of the older inventorie4s (e.g. DeGraff 1990, Andereck, 2007) which were only available in paper format.
- We compiled landslide inventories for five recent events from the maintenance records of the Ministry of Public Works.
- We generated a completely new landslide inventory using multi-temporal visual image interpretation, and generated an extensive landslide database for Dominica.
- We updated the land use map as much as possible.
- We generated a national building map in the form of building points.
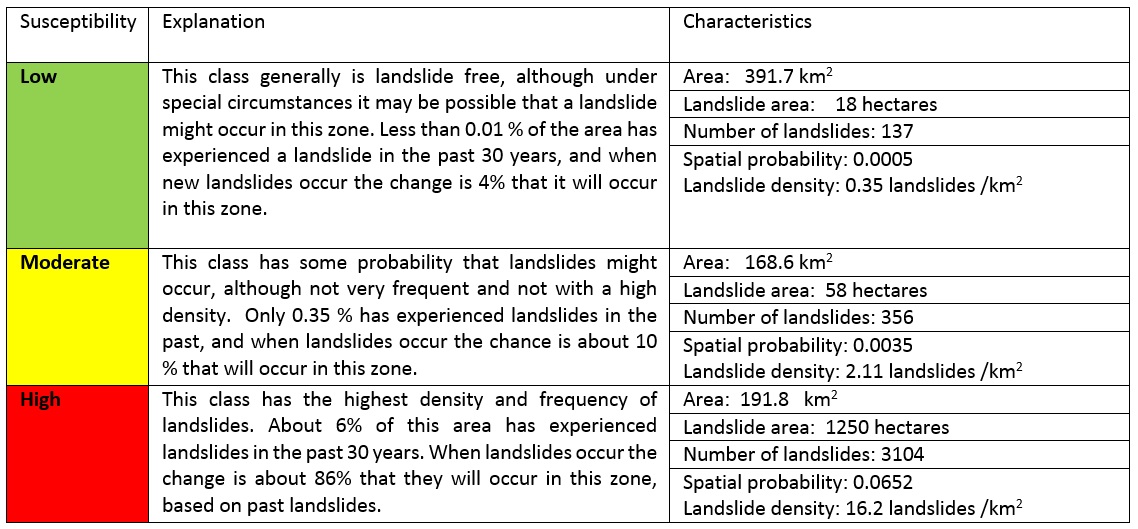
Table 9. Characterization of the legend classes of the final Landslide susceptibility map for Dominica.
Recommendations:
The landslide susceptibility map should be used with care. It is a national-scale map and cannot be used to provide local scale solutions. The recommended use of the susceptibility classes is shown below:
- Low landslide susceptibility zone. For planners there is no limitation with respect to expected landslide problems in the development of these areas. No special care should be taken by engineers with respect to planning and maintaining infrastructure in these areas with respect to landslides. Of course it is important to also check the flood hazard maps for these areas, as areas that are flat and near a river or coast might be still flood prone.
- Moderate landslide susceptibility zone. It is advised to carry out a more detailed landslide study for residential development and for critical infrastructure. There is no need to avoid these areas altogether, but care should be taken that landslides might occur. The legend of the susceptibility map should give an indication as to how frequent and how much landslides might occur in these areas. The size of the moderate class in susceptibility maps should be kept as low as possible
- High landslide susceptibility zones. There are severe restrictions with respect to expected landslide problems in these areas. The best is to avoid these areas in the development of future residential areas or critical infrastructure whenever possible. Development plans should always incorporate a more detailed study of landslide hazard in these areas. Engineers should consider the high landslide hazard when designing or maintaining infrastructure.
References:
Andereck, Z. D. (2007). Mapping Vulnerability of Infrastructure to Destruction by Slope Failures on the Island of Dominica , WI : A CASE STUDY OF GRAND FOND , PETITE SOUFRIERE , AND MOURNE JAUNE. Faculty of Miami University.Areces-Mallea, A., Weakley, A.S., Li, X., Sayre, R.G., Parrish, J.D., Tipton, C.V., and Boucher, T., 1999. A guide to Caribbean vegetation types: classification systems and descriptions. Arlington, Va., The Nature Conservancy.
Coan, M., Wood, E., and Reillo, P. (2007). Forest Formation and Land Cover Map Series: Dominica. http://lca.usgs.gov/lca/carland/data/dominica/dominica_lulc_final.tif.htm
Corominas, J., & Mavrouli, O. C. (2011). Guidelines for landslide susceptibility, hazard, and risk assessment and zoning. Retrieved from http://safeland-fp7.eu/results/Documents/D2.4.pdf
Corominas, J., van Westen, C. ., Frattini, P., Cascini, L., Malet, J.-P., Fotopoulou, S., … Smith, J. T. (2014). Recommendations for the quantitative analysis of landslide risk. Bulletin of Engineering Geology and the Environment, 73(2), 209–263. doi:10.1007/s10064-013-0538-8
Cruden, D. M., & Varnes, D. J. (1996). Landslide Types and Processes. In A. K. Turner & R. L. Schuster (Eds.), Landslides Investigation and mitigation. Transportation Research Board. Spetial report 247. (pp. 36–75). Washington, D. C.: Transportation Research Board.
DeGraff, J.V. 1990a. Post-1987 Landslides on Dominica, West Indies: An Assessment of LandslideHazard Map Reliability and Initial Evaluation of Vegetation Effect on Slope Stability, Submitted to The Commonwealth of Dominica and the OAS
DeGraff, J.V. 1990b, Potential Landslide-Dam Hazard Below Freshwater Lake, Commonwealth of Dominica, West Indies, Report submitted to Commonwealth of Dominica and the OAS
DeGraff, J. V., 1991: Determining the significance of landslide activity: Examples from the Eastern Caribbean. Caribb. Geogr., 3, 31–42.
DeGraff, J. V., 1995, Natural Hazards Vulnerability of the Dominica Hydroelectric Expansion Project: Caribbean Disaster Mitigation Project Final Report, Organization of American States, Washington, DC, 26 p.
DeGraff, J. V., 1997, Technical Assessment of the Landslide-Dam Emergency, Commonwealth of Dominica, W.I.: U.S. Agency for International Development Report, Office of the U.S. Foreign Disaster Assistance, Washington, DC, 24 p.
DeGraff, J.V., James, A. and Breheney, P., 2010. The Formation and Persistence of the Matthieu Landslide-Dam Lake, Dominica, W.I.. Environmental & Engineering Geoscience, Vol. XVI, No. 2, May 2010, pp. 73–89
DeGraff, J.V., Romesburg, H.C., Ahmad, R, and McCalpin, J. 2012. Producing landslide-susceptibility maps for regional planning in data-scarce regions. Nat Hazards (2012) 64:729–749
DeGraff, J. V. and Rogers, C. T., 2003, An unusual landslide dam event in Dominica, West Indies: Landslide News, No. 14/15, pp. 8–11.
DeGraff, J.V., Bryce, R., Jibson, R.W., Mora, S., and Rogers, C.T. 1989. Landslides: Their extent and significance in the Caribbean. In E.E. Brabb and B.L. Harrod (eds), Landslides: Extent and Economic Significance. p. 51-80. Rotterdam: A.A. Balkema
DeGraff, J. (1990). Post 1987 landslides in Dominica, West Indies: An assessment of landslide-hazard map reliability and initial evaluation of vegetation efect on slope stability. Fresno, California.
Fell, R., Corominas, J., Bonnard, C., Cascini, L., Leroi, E., & Savage, W. Z. (2008). Guidelines for landslide susceptibility, hazard and risk zoning for land use planning. Engineering Geology, 102(3-4), 85–98. doi:10.1016/j.enggeo.2008.03.022
James, A., & De Graff, J. V. (2012). The draining of Matthieu landslide-dam lake, Dominica, West Indies. Landslides, 9(4), 529–537. doi:10.1007/s10346-012-0333-9
Lang, D.M. 1967. Soil map of Dominica. 2 sheets
Lindsay, J. M., A. L. Smith, M. J. Roobol, and M. V. Stasuik (2005), Dominica, in Volcanic Hazard Atlas of the Lesser Antilles, edited by J. M. Lindsay et al., pp. 1–48, Seismic Res. Unit, Univ. of the West Indies, St. Augustine, Trinidad and Tobago.
Roobol, M. J. and Smith, A. L., 2004, Geologic Map of Dominica, West Indies: Geology Department, University of Puerto Rico at Mayaguez. Electronic document, available at http://www.caribbeanvolcanoes.com/dominica/content/dominicamap.pdf
Soeters, R., & Westen, C. J. van. (1996). Slope instability recognition, analysis and zonation. In A. K. Turner & R. L. Schuster (Eds.), Landslides Investigation and Mitigation. Transportation Research Board Special Report 247. (pp. 129–177). Washington, D. C.: Transportation Research Board.
SRU 2000, Seismic Research Unit, University of the West Indies. Volcano Hazard Report for Southern Dominica: Interpretation of 1998-2000 Earthquakes and Hazard Mapping Results. 49 pages. http://www.mona.uwi.edu/cardin/virtual_library/docs/1146/1146.pdf
Last update: 10 - 03 - 2016